

Dolzarb patternlar

Двойная вершина
сформирован 28.03 в 17:00:04 (UTC+0)
сила сигнала 3 из 5
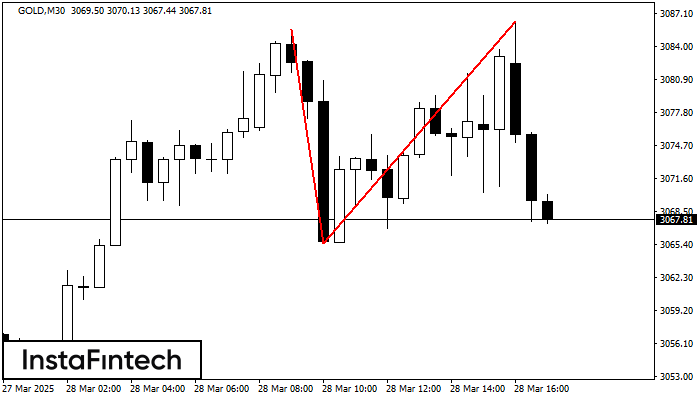
По торговому инструменту GOLD на M30 сформировалась фигура «Двойная вершина», которая сигнализирует нам об изменении тенденции с восходящей на нисходящую. Вероятно, что, в случае пробоя основания фигуры 3065.51, возможно дальнейшее нисходящее движение.
- Все
- Все
- Bearish Rectangle
- Bearish Symmetrical Triangle
- Bearish Symmetrical Triangle
- Bullish Rectangle
- Double Top
- Double Top
- Triple Bottom
- Triple Bottom
- Triple Top
- Triple Top
- Все
- Все
- Покупка
- Продажа
- Все
- 1
- 2
- 3
- 4
- 5
Triple Bottom
сформирован 25.05 в 15:59:45 (UTC+0)
сила сигнала 4 из 5

The Triple Bottom pattern has formed on the chart of the #Bitcoin H1 trading instrument. The pattern signals a change in the trend from downwards to upwards in the case
Открыть график инструмента в новом окне
Double Bottom
сформирован 25.05 в 12:20:13 (UTC+0)
сила сигнала 1 из 5

The Double Bottom pattern has been formed on #Bitcoin M5. Characteristics: the support level 106888.42; the resistance level 107214.56; the width of the pattern 32614 points. If the resistance level
The M5 and M15 time frames may have more false entry points.
Открыть график инструмента в новом окне
Bullish Rectangle
сформирован 25.05 в 07:55:30 (UTC+0)
сила сигнала 1 из 5

According to the chart of M5, #Bitcoin formed the Bullish Rectangle which is a pattern of a trend continuation. The pattern is contained within the following borders: the lower border
The M5 and M15 time frames may have more false entry points.
Открыть график инструмента в новом окне


