

Dolzarb patternlar

Двойная вершина
сформирован 27.03 в 11:05:29 (UTC+0)
сила сигнала 1 из 5
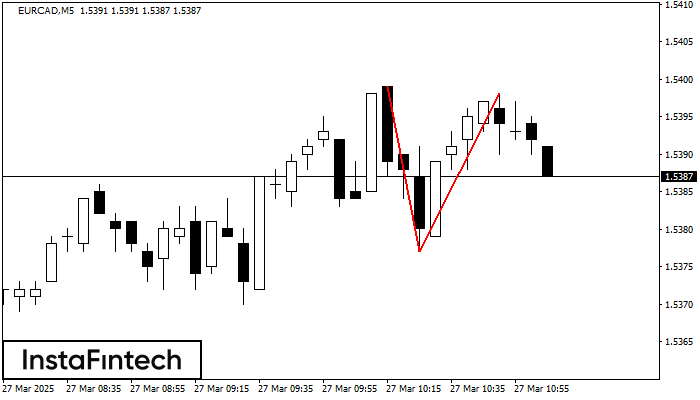
На торговом графике EURCAD M5 сформировалась разворотная фигура «Двойная вершина». Характеристика: Верхняя граница 1.5398; Нижняя граница 1.5377; Ширина фигуры 21 пунктов. Сигнал: Пробой нижней границы 1.5377 приведет к дальнейшему нисходящему движению с перспективой хода к уровню 1.5362.
Таймфреймы М5 и М15 могут иметь больше ложных точек входа.
- Все
- Все
- Bearish Rectangle
- Bearish Symmetrical Triangle
- Bearish Symmetrical Triangle
- Bullish Rectangle
- Double Top
- Double Top
- Triple Bottom
- Triple Bottom
- Triple Top
- Triple Top
- Все
- Все
- Покупка
- Продажа
- Все
- 1
- 2
- 3
- 4
- 5
Bullish Symmetrical Triangle
сформирован 24.05 в 18:46:25 (UTC+0)
сила сигнала 2 из 5

According to the chart of M15, #Bitcoin formed the Bullish Symmetrical Triangle pattern, which signals the trend will continue. Description. The upper border of the pattern touches the coordinates 109440.14/108872.57
The M5 and M15 time frames may have more false entry points.
Открыть график инструмента в новом окне
Bearish Rectangle
сформирован 23.05 в 23:00:20 (UTC+0)
сила сигнала 1 из 5

According to the chart of M5, EURNZD formed the Bearish Rectangle. The pattern indicates a trend continuation. The upper border is 1.8982, the lower border is 1.8964. The signal means
The M5 and M15 time frames may have more false entry points.
Открыть график инструмента в новом окне
Bullish Symmetrical Triangle
сформирован 23.05 в 22:14:53 (UTC+0)
сила сигнала 1 из 5

According to the chart of M5, AUDCHF formed the Bullish Symmetrical Triangle pattern. Description: This is the pattern of a trend continuation. 0.5335 and 0.5329 are the coordinates
The M5 and M15 time frames may have more false entry points.
Открыть график инструмента в новом окне


