

Dolzarb patternlar

Двойная вершина
сформирован 27.03 в 09:30:12 (UTC+0)
сила сигнала 2 из 5
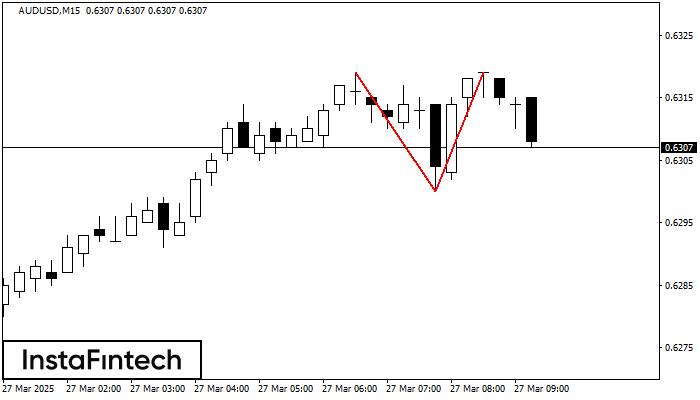
По торговому инструменту AUDUSD на M15 сформировалась фигура «Двойная вершина», которая сигнализирует нам об изменении тенденции с восходящей на нисходящую. Вероятно, что, в случае пробоя основания фигуры 0.6300, возможно дальнейшее нисходящее движение.
Таймфреймы М5 и М15 могут иметь больше ложных точек входа.
- Все
- Все
- Bearish Rectangle
- Bearish Symmetrical Triangle
- Bearish Symmetrical Triangle
- Bullish Rectangle
- Double Top
- Double Top
- Triple Bottom
- Triple Bottom
- Triple Top
- Triple Top
- Все
- Все
- Покупка
- Продажа
- Все
- 1
- 2
- 3
- 4
- 5
Bullish Symmetrical Triangle
сформирован 28.05 в 10:04:32 (UTC+0)
сила сигнала 2 из 5
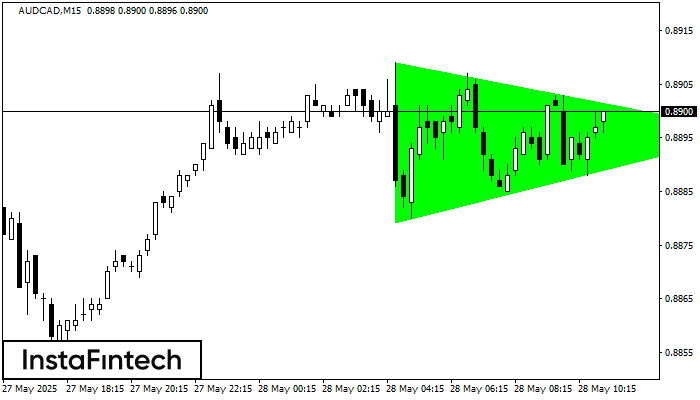
According to the chart of M15, AUDCAD formed the Bullish Symmetrical Triangle pattern. The lower border of the pattern touches the coordinates 0.8879/0.8896 whereas the upper border goes across 0.8909/0.8896
The M5 and M15 time frames may have more false entry points.
Открыть график инструмента в новом окне
Bearish pennant
сформирован 28.05 в 08:12:58 (UTC+0)
сила сигнала 1 из 5

The Bearish pennant pattern has formed on the GBPJPY M5 chart. It signals potential continuation of the existing trend. Specifications: the pattern’s bottom has the coordinate of 194.35; the projection
The M5 and M15 time frames may have more false entry points.
Открыть график инструмента в новом окне
Bullish Symmetrical Triangle
сформирован 28.05 в 07:55:36 (UTC+0)
сила сигнала 1 из 5

According to the chart of M5, GBPAUD formed the Bullish Symmetrical Triangle pattern, which signals the trend will continue. Description. The upper border of the pattern touches the coordinates 2.0988/2.0939
The M5 and M15 time frames may have more false entry points.
Открыть график инструмента в новом окне


