

Dolzarb patternlar

Прямоугольник
сформирован 27.03 в 06:07:54 (UTC+0)
сила сигнала 1 из 5

Сформирована фигура «Прямоугольник» на графике USDJPY M5. Тип фигуры: Продолжение тренда; Границы: Верхняя 150.29, Нижняя 150.10; Сигнал: позиция на продажу открывается после фиксации цены ниже границы прямоугольника 150.10.
Таймфреймы М5 и М15 могут иметь больше ложных точек входа.
- Все
- Все
- Bearish Rectangle
- Bearish Symmetrical Triangle
- Bearish Symmetrical Triangle
- Bullish Rectangle
- Double Top
- Double Top
- Triple Bottom
- Triple Bottom
- Triple Top
- Triple Top
- Все
- Все
- Покупка
- Продажа
- Все
- 1
- 2
- 3
- 4
- 5
Bullish Rectangle
was formed on 21.05 at 04:25:18 (UTC+0)
signal strength 3 of 5
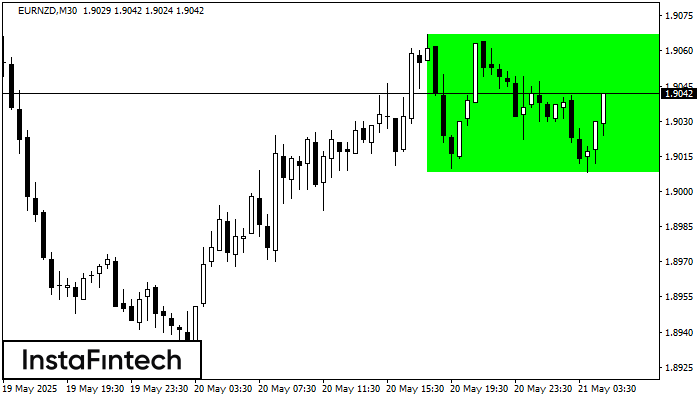
According to the chart of M30, EURNZD formed the Bullish Rectangle which is a pattern of a trend continuation. The pattern is contained within the following borders: the lower border
Open chart in a new window
Double Top
was formed on 21.05 at 03:59:57 (UTC+0)
signal strength 3 of 5
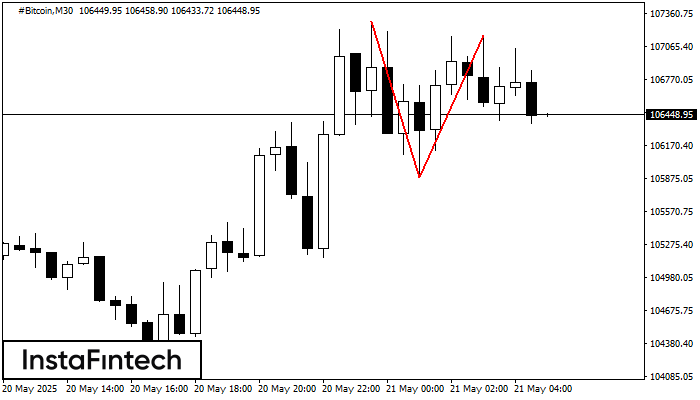
On the chart of #Bitcoin M30 the Double Top reversal pattern has been formed. Characteristics: the upper boundary 107168.31; the lower boundary 105877.93; the width of the pattern 129038 points
Open chart in a new window
Head and Shoulders
was formed on 21.05 at 03:00:10 (UTC+0)
signal strength 3 of 5
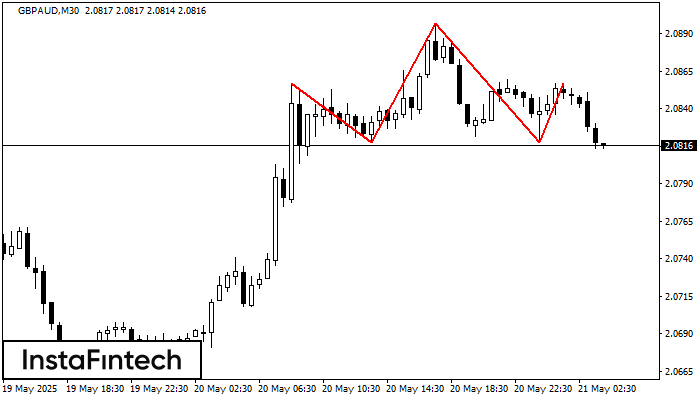
The GBPAUD M30 formed the Head and Shoulders pattern with the following features: The Head’s top is at 2.0897, the Neckline and the upward angle are at 2.0818/2.0818. The formation
Open chart in a new window


