

Dolzarb patternlar

Прямоугольник
сформирован 24.03 в 03:53:59 (UTC+0)
сила сигнала 3 из 5
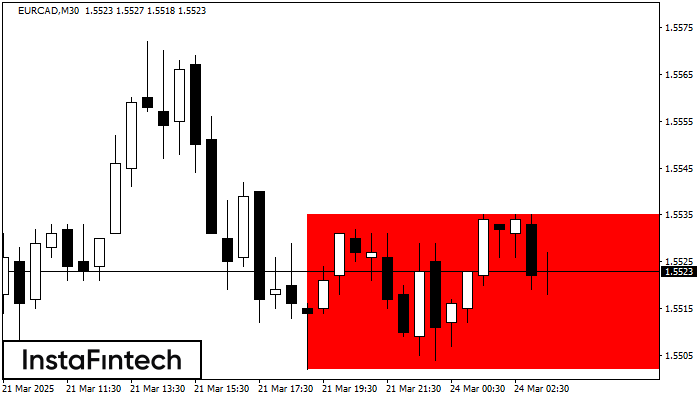
Сформирована фигура «Прямоугольник» на графике EURCAD M30. Тип фигуры: Продолжение тренда; Границы: Верхняя 1.5535, Нижняя 1.5502; Сигнал: позиция на продажу открывается после фиксации цены ниже границы прямоугольника 1.5502.
- Все
- Все
- Bearish Rectangle
- Bearish Symmetrical Triangle
- Bearish Symmetrical Triangle
- Bullish Rectangle
- Double Top
- Double Top
- Triple Bottom
- Triple Bottom
- Triple Top
- Triple Top
- Все
- Все
- Покупка
- Продажа
- Все
- 1
- 2
- 3
- 4
- 5
Triple Bottom
was formed on 14.05 at 22:20:33 (UTC+0)
signal strength 1 of 5
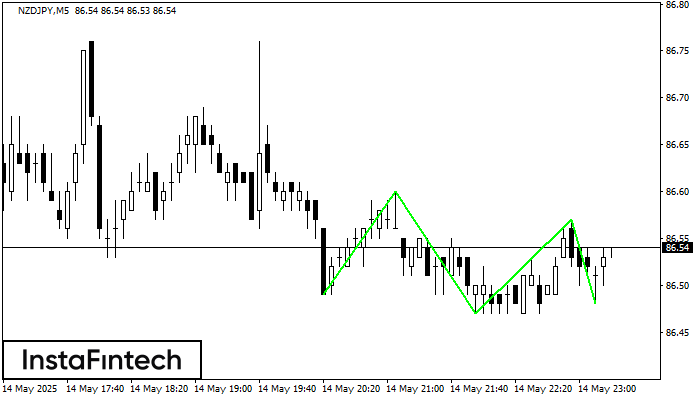
The Triple Bottom pattern has been formed on NZDJPY M5. It has the following characteristics: resistance level 86.60/86.57; support level 86.49/86.48; the width is 11 points. In the event
The M5 and M15 time frames may have more false entry points.
Open chart in a new window
Double Top
was formed on 14.05 at 22:00:08 (UTC+0)
signal strength 2 of 5
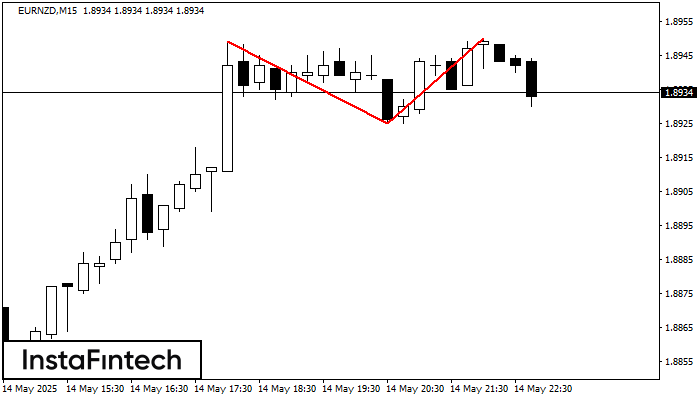
On the chart of EURNZD M15 the Double Top reversal pattern has been formed. Characteristics: the upper boundary 1.8950; the lower boundary 1.8925; the width of the pattern 25 points
The M5 and M15 time frames may have more false entry points.
Open chart in a new window
Double Bottom
was formed on 14.05 at 21:50:08 (UTC+0)
signal strength 1 of 5
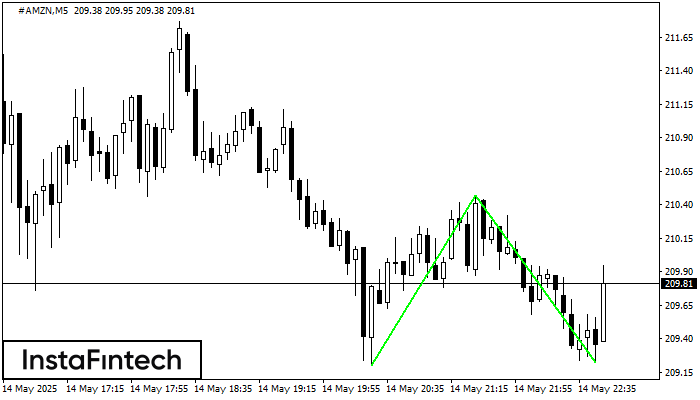
The Double Bottom pattern has been formed on #AMZN M5; the upper boundary is 210.47; the lower boundary is 209.22. The width of the pattern is 127 points. In case
The M5 and M15 time frames may have more false entry points.
Open chart in a new window


