

Dolzarb patternlar

Двойная вершина
сформирован 24.03 в 03:25:45 (UTC+0)
сила сигнала 1 из 5
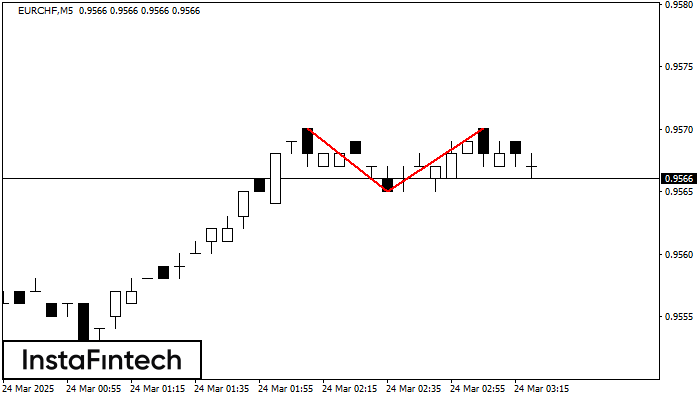
На торговом графике EURCHF M5 сформировалась разворотная фигура «Двойная вершина». Характеристика: Верхняя граница 0.9570; Нижняя граница 0.9565; Ширина фигуры 5 пунктов. Сигнал: Пробой нижней границы 0.9565 приведет к дальнейшему нисходящему движению с перспективой хода к уровню 0.9550.
Таймфреймы М5 и М15 могут иметь больше ложных точек входа.
- Все
- Все
- Bearish Rectangle
- Bearish Symmetrical Triangle
- Bearish Symmetrical Triangle
- Bullish Rectangle
- Double Top
- Double Top
- Triple Bottom
- Triple Bottom
- Triple Top
- Triple Top
- Все
- Все
- Покупка
- Продажа
- Все
- 1
- 2
- 3
- 4
- 5
รูปแบบกราฟหัวและหัวไหล่ (Head and Shoulders)
was formed on 21.05 at 03:00:10 (UTC+0)
signal strength 3 of 5
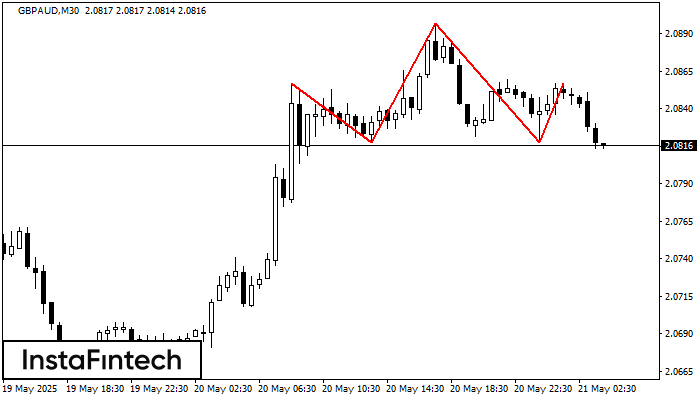
GBPAUD M30 ได้สร้างรูปแบบ รูปแบบกราฟหัวและหัวไหล่ (Head and Shoulders) พร้อมกับคุณลักษณะดังต่อไปนี้ : ระดับสูงของตำแหน่งหัวอยู่ที่ 2.0897, ตำแหน่งคอ และมุมขาขึ้นอยู่ที่ 2.0818/2.0818 การก่อตัวของรูปแบบเช่นนี้
Open chart in a new window
รูปแบบกราฟหัวและหัวไหล่แบบกลับหัว (Inverse Head and Shoulder)
was formed on 16.05 at 15:30:27 (UTC+0)
signal strength 3 of 5
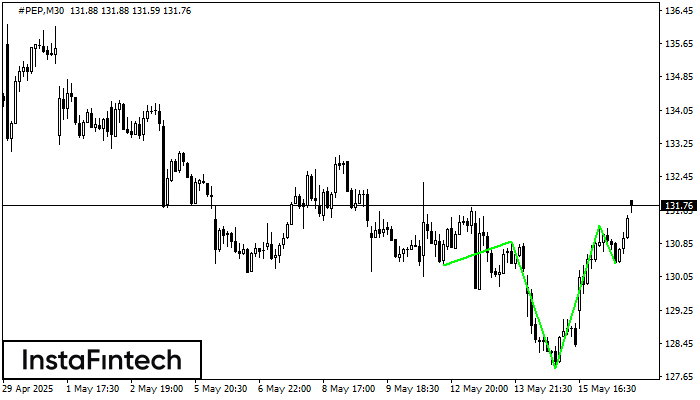
อ้างอิงจาก M30, #PEP กำลังก่อรูปแบบทางเทคนิคขึ้นมา รูปแบบกราฟหัวและหัวไหล่แบบกลับหัว (Inverse Head and Shoulder) ในกรณีที่มีการเคลื่อนตัวทะลุผ่านตำแหน่งคอ 130.89/131.28 ออกไป ตราสารก็อาจจะเคลื่อนตัวไปยัง 131.58
Open chart in a new window
รูปแบบกราฟหัวและหัวไหล่แบบกลับหัว (Inverse Head and Shoulder)
was formed on 16.05 at 15:30:18 (UTC+0)
signal strength 3 of 5

อ้างอิงจากชาร์ตของ M30, #PEP ที่ได้สร้างรูปแบบตาม รูปแบบกราฟหัวและหัวไหล่แบบกลับหัว (Inverse Head and Shoulder) ตำแหน่งของหัวอยู่ใน 127.86 ระหว่างนั้นเส้นระดับกลางของตำแหน่งคอ อยู่ในระดับที่ 130.89/131.28 การก่อตัวของรูปแบบ
Open chart in a new window


