

Актуальні патерни

Патерни - це графічні моделі, які "малюють" ціни на графіку. Один з постулатів технічного аналізу говорить нам про те, що історія (рух ціни) завжди повторюється. Це означає, що в схожих ситуаціях рух ціни, найчастіше, буде схожим, що дозволяє з високою часткою ймовірності спрогнозувати подальший розвиток ситуації.
Актуальні патерни від ІнстаФорекс - це зручний сервіс, який дозволить вам завжди бути в курсі останніх змін на ринку і вчасно реагувати на підказки, що з'явилися, від ринку. У нашому сервісі ви завжди знайдете найсвіжіші і актуальніші патерни на будь-якій парі і на будь-якому таймфреймі.
Медвежий симметричный треугольник
сформирован 22.04 в 08:47:25 (UTC+0)
сила сигнала 1 из 5

По EURNZD M5 сформировалась фигура «Медвежий симметричный треугольник». Данная фигура сигнализирует нам о продолжении нисходящего тренда в случае пробоя нижней границы 1.9139, где вероятная прибыль будет являться шириной текущей фигуры -34 пунктов.
Таймфреймы М5 и М15 могут иметь больше ложных точек входа.
- Все
- Все
- Bearish Rectangle
- Bearish Symmetrical Triangle
- Bearish Symmetrical Triangle
- Bullish Rectangle
- Double Top
- Double Top
- Triple Bottom
- Triple Bottom
- Triple Top
- Triple Top
- Все
- Все
- Покупка
- Продажа
- Все
- 1
- 2
- 3
- 4
- 5
Bullish Rectangle
was formed on 08.05 at 07:42:13 (UTC+0)
signal strength 1 of 5
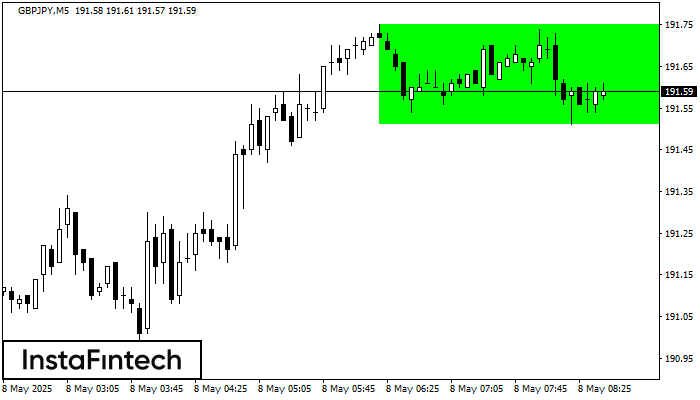
According to the chart of M5, GBPJPY formed the Bullish Rectangle. The pattern indicates a trend continuation. The upper border is 191.75, the lower border is 191.51. The signal means
The M5 and M15 time frames may have more false entry points.
Open chart in a new window
Triple Top
was formed on 08.05 at 07:30:25 (UTC+0)
signal strength 2 of 5
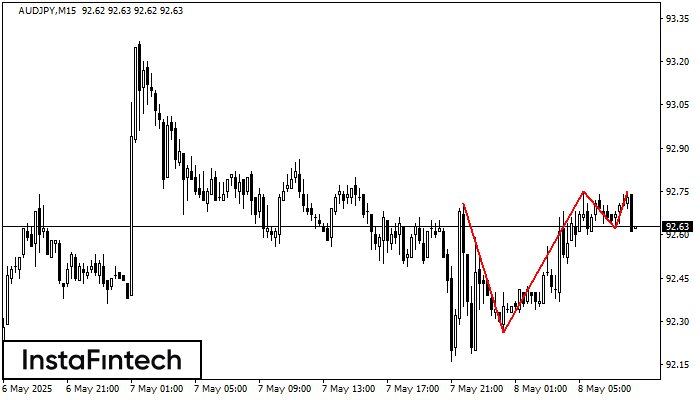
The Triple Top pattern has formed on the chart of the AUDJPY M15 trading instrument. It is a reversal pattern featuring the following characteristics: resistance level -4, support level -36
The M5 and M15 time frames may have more false entry points.
Open chart in a new window
Triple Top
was formed on 08.05 at 07:15:11 (UTC+0)
signal strength 1 of 5
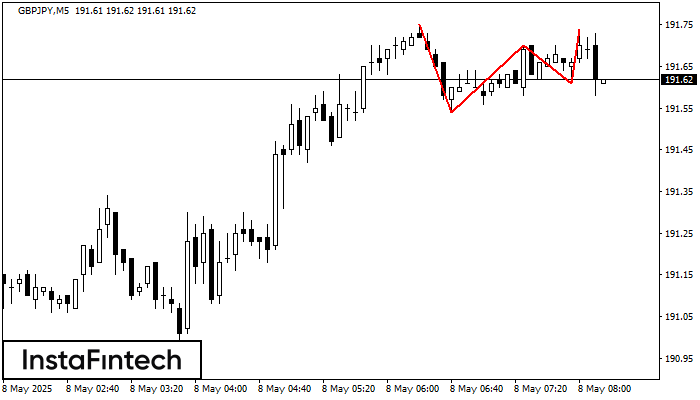
On the chart of the GBPJPY M5 trading instrument, the Triple Top pattern that signals a trend change has formed. It is possible that after formation of the third peak
The M5 and M15 time frames may have more false entry points.
Open chart in a new window


