

Актуальні патерни

Патерни - це графічні моделі, які "малюють" ціни на графіку. Один з постулатів технічного аналізу говорить нам про те, що історія (рух ціни) завжди повторюється. Це означає, що в схожих ситуаціях рух ціни, найчастіше, буде схожим, що дозволяє з високою часткою ймовірності спрогнозувати подальший розвиток ситуації.
Актуальні патерни від ІнстаФорекс - це зручний сервіс, який дозволить вам завжди бути в курсі останніх змін на ринку і вчасно реагувати на підказки, що з'явилися, від ринку. У нашому сервісі ви завжди знайдете найсвіжіші і актуальніші патерни на будь-якій парі і на будь-якому таймфреймі.
Прямоугольник
сформирован 15.04 в 06:49:58 (UTC+0)
сила сигнала 4 из 5
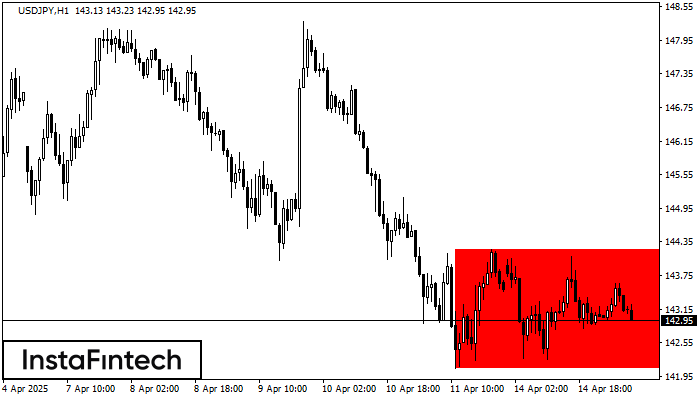
Сформирована фигура «Прямоугольник» на графике USDJPY H1. Тип фигуры: Продолжение тренда; Границы: Верхняя 144.21, Нижняя 142.08; Сигнал: позиция на продажу открывается после фиксации цены ниже границы прямоугольника 142.08.
- Все
- Все
- Bearish Rectangle
- Bearish Symmetrical Triangle
- Bearish Symmetrical Triangle
- Bullish Rectangle
- Double Top
- Double Top
- Triple Bottom
- Triple Bottom
- Triple Top
- Triple Top
- Все
- Все
- Покупка
- Продажа
- Все
- 1
- 2
- 3
- 4
- 5
Double Bottom
was formed on 13.05 at 05:00:05 (UTC+0)
signal strength 4 of 5
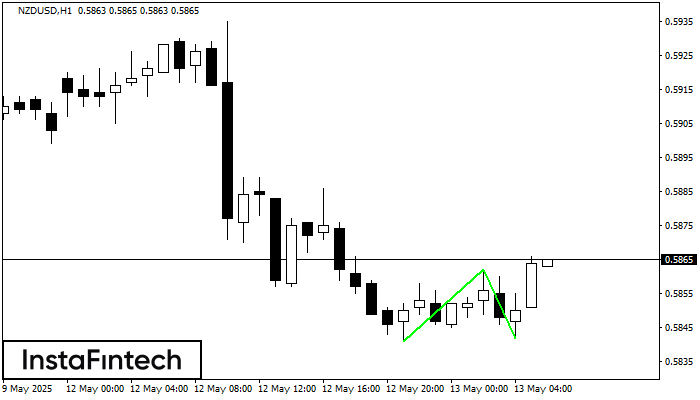
The Double Bottom pattern has been formed on NZDUSD H1; the upper boundary is 0.5862; the lower boundary is 0.5842. The width of the pattern is 21 points. In case
Open chart in a new window
Double Bottom
was formed on 13.05 at 04:59:55 (UTC+0)
signal strength 3 of 5
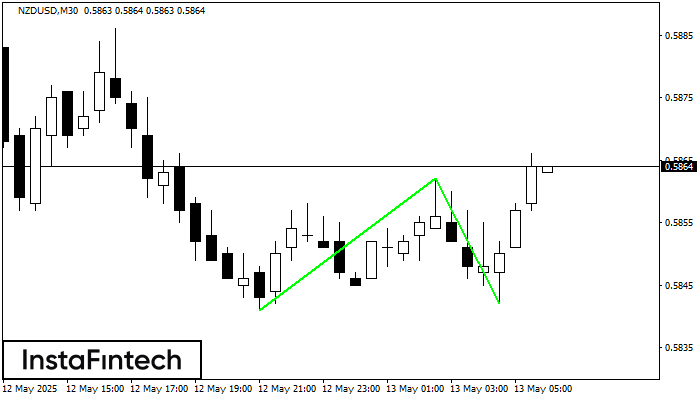
The Double Bottom pattern has been formed on NZDUSD M30. This formation signals a reversal of the trend from downwards to upwards. The signal is that a buy trade should
Open chart in a new window
Double Bottom
was formed on 13.05 at 04:29:54 (UTC+0)
signal strength 3 of 5
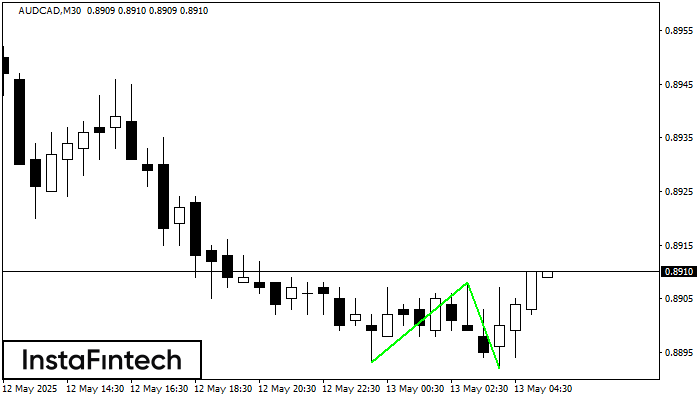
The Double Bottom pattern has been formed on AUDCAD M30. This formation signals a reversal of the trend from downwards to upwards. The signal is that a buy trade should
Open chart in a new window


