

Актуальні патерни

Патерни - це графічні моделі, які "малюють" ціни на графіку. Один з постулатів технічного аналізу говорить нам про те, що історія (рух ціни) завжди повторюється. Це означає, що в схожих ситуаціях рух ціни, найчастіше, буде схожим, що дозволяє з високою часткою ймовірності спрогнозувати подальший розвиток ситуації.
Актуальні патерни від ІнстаФорекс - це зручний сервіс, який дозволить вам завжди бути в курсі останніх змін на ринку і вчасно реагувати на підказки, що з'явилися, від ринку. У нашому сервісі ви завжди знайдете найсвіжіші і актуальніші патерни на будь-якій парі і на будь-якому таймфреймі.
Бычий симметричный треугольник
сформирован 14.04 в 12:56:06 (UTC+0)
сила сигнала 1 из 5

По NZDJPY на M5 фигура «Бычий симметричный треугольник». Характеристика: Фигура продолжения тренда; Координаты границ – верхняя 84.17, нижняя 83.88. Проекция ширины фигуры 29 пунктов. Прогноз: В случае пробоя верхней границы 84.17 цена, вероятнее всего, продолжит движение к 84.15.
Таймфреймы М5 и М15 могут иметь больше ложных точек входа.
Дивіться також
- Все
- Все
- Bearish Rectangle
- Bearish Symmetrical Triangle
- Bearish Symmetrical Triangle
- Bullish Rectangle
- Double Top
- Double Top
- Triple Bottom
- Triple Bottom
- Triple Top
- Triple Top
- Все
- Все
- Покупка
- Продажа
- Все
- 1
- 2
- 3
- 4
- 5
Triple Bottom
was formed on 08.05 at 12:20:35 (UTC+0)
signal strength 1 of 5

The Triple Bottom pattern has formed on the chart of GBPCHF M5. Features of the pattern: The lower line of the pattern has coordinates 1.0970 with the upper limit 1.0970/1.0964
The M5 and M15 time frames may have more false entry points.
Open chart in a new window
Bullish Flag
was formed on 08.05 at 12:10:56 (UTC+0)
signal strength 2 of 5

The Bullish Flag pattern has been formed on EURJPY at M15. The lower boundary of the pattern is located at 163.36/163.14, while the higher boundary lies at 163.60/163.38. The projection
The M5 and M15 time frames may have more false entry points.
Open chart in a new window
Bullish pennant
was formed on 08.05 at 12:10:51 (UTC+0)
signal strength 2 of 5
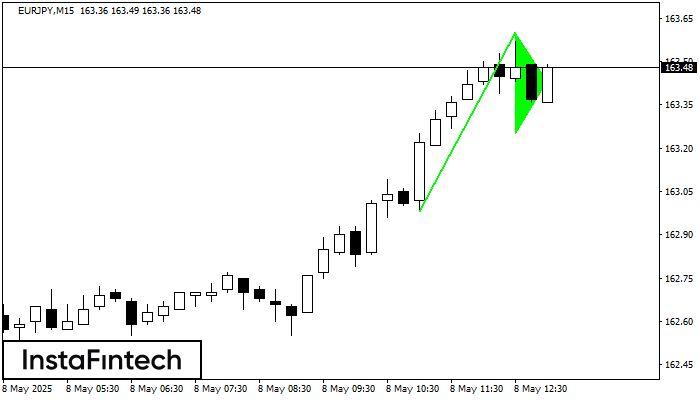
The Bullish pennant graphic pattern has formed on the EURJPY M15 instrument. This pattern type falls under the category of continuation patterns. In this case, if the quote can breaks
The M5 and M15 time frames may have more false entry points.
Open chart in a new window


