

Актуальні патерни

Патерни - це графічні моделі, які "малюють" ціни на графіку. Один з постулатів технічного аналізу говорить нам про те, що історія (рух ціни) завжди повторюється. Це означає, що в схожих ситуаціях рух ціни, найчастіше, буде схожим, що дозволяє з високою часткою ймовірності спрогнозувати подальший розвиток ситуації.
Актуальні патерни від ІнстаФорекс - це зручний сервіс, який дозволить вам завжди бути в курсі останніх змін на ринку і вчасно реагувати на підказки, що з'явилися, від ринку. У нашому сервісі ви завжди знайдете найсвіжіші і актуальніші патерни на будь-якій парі і на будь-якому таймфреймі.
Медвежий вымпел
сформирован 13.04 в 23:29:15 (UTC+0)
сила сигнала 1 из 5
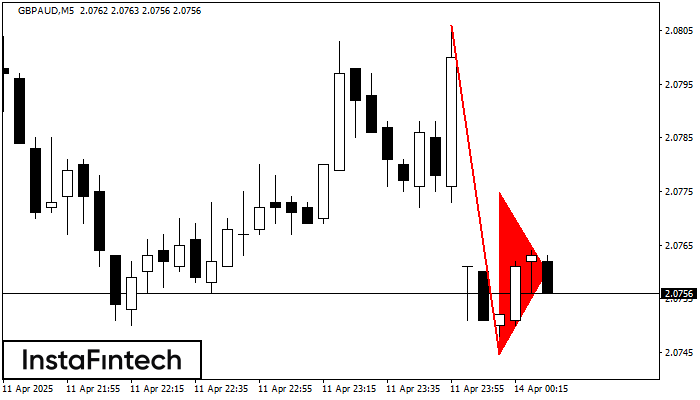
На графике GBPAUD M5 сформировалась фигура «Медвежий вымпел». Фигура сигнализирует о продолжении нисходящего тренда в случае пробоя минимума вымпела 2.0745. Рекомендации: Отложенный ордер Sell Stop выставляется на 10 пунктов ниже минимума фигуры. Тейк Профит выставляется на расстояние проекции высоты флагштока.
Таймфреймы М5 и М15 могут иметь больше ложных точек входа.
Дивіться також
- Все
- Все
- Bearish Rectangle
- Bearish Symmetrical Triangle
- Bearish Symmetrical Triangle
- Bullish Rectangle
- Double Top
- Double Top
- Triple Bottom
- Triple Bottom
- Triple Top
- Triple Top
- Все
- Все
- Покупка
- Продажа
- Все
- 1
- 2
- 3
- 4
- 5
Triple Bottom
was formed on 06.05 at 03:00:35 (UTC+0)
signal strength 4 of 5

The Triple Bottom pattern has been formed on GBPCHF H1. It has the following characteristics: resistance level 1.0997/1.0988; support level 1.0919/1.0919; the width is 78 points. In the event
Open chart in a new window
Triple Bottom
was formed on 06.05 at 03:00:33 (UTC+0)
signal strength 4 of 5
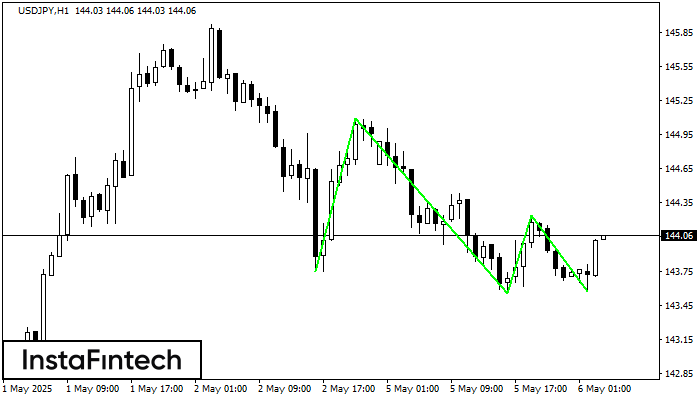
The Triple Bottom pattern has formed on the chart of USDJPY H1. Features of the pattern: The lower line of the pattern has coordinates 145.09 with the upper limit 145.09/144.24
Open chart in a new window
Triple Bottom
was formed on 06.05 at 03:00:33 (UTC+0)
signal strength 4 of 5
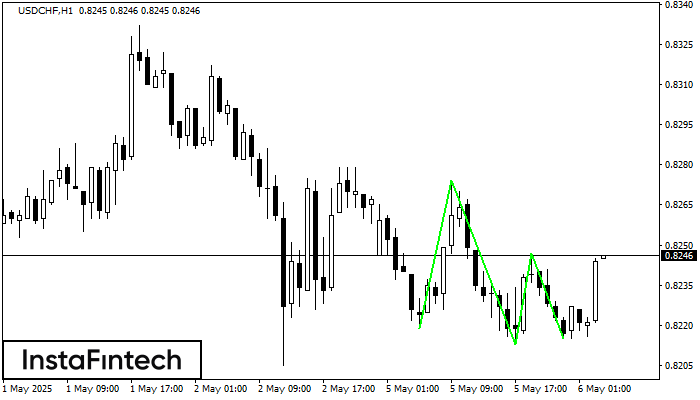
The Triple Bottom pattern has formed on the chart of the USDCHF H1 trading instrument. The pattern signals a change in the trend from downwards to upwards in the case
Open chart in a new window


