

Актуальні патерни

Патерни - це графічні моделі, які "малюють" ціни на графіку. Один з постулатів технічного аналізу говорить нам про те, що історія (рух ціни) завжди повторюється. Це означає, що в схожих ситуаціях рух ціни, найчастіше, буде схожим, що дозволяє з високою часткою ймовірності спрогнозувати подальший розвиток ситуації.
Актуальні патерни від ІнстаФорекс - це зручний сервіс, який дозволить вам завжди бути в курсі останніх змін на ринку і вчасно реагувати на підказки, що з'явилися, від ринку. У нашому сервісі ви завжди знайдете найсвіжіші і актуальніші патерни на будь-якій парі і на будь-якому таймфреймі.
Медвежий вымпел
сформирован 04.04 в 16:11:55 (UTC+0)
сила сигнала 1 из 5
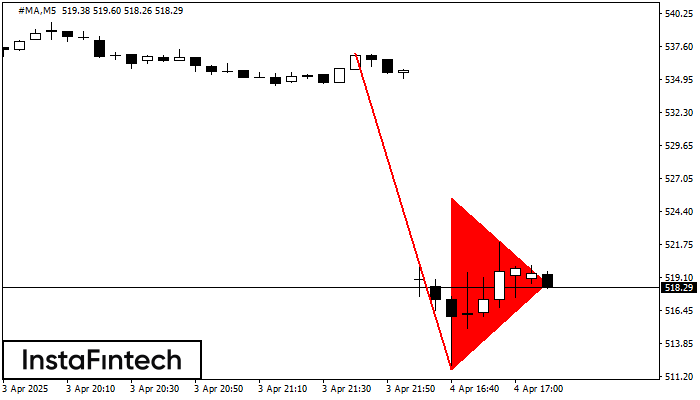
По торговому инструменту #MA на M5 сформировалась графическая фигура «Медвежий вымпел». Фигура данного типа характеризует небольшое замедление, после которого движение продолжится в исходном тренде. В случае если котировке удастся зафиксироваться ниже минимума образованной фигуры 511.79, трейдеру представится возможность удачно войти в позицию на продажу.
Таймфреймы М5 и М15 могут иметь больше ложных точек входа.
Дивіться також
- Все
- Все
- Bearish Rectangle
- Bearish Symmetrical Triangle
- Bearish Symmetrical Triangle
- Bullish Rectangle
- Double Top
- Double Top
- Triple Bottom
- Triple Bottom
- Triple Top
- Triple Top
- Все
- Все
- Покупка
- Продажа
- Все
- 1
- 2
- 3
- 4
- 5
Double Bottom
was formed on 22.04 at 05:55:18 (UTC+0)
signal strength 1 of 5
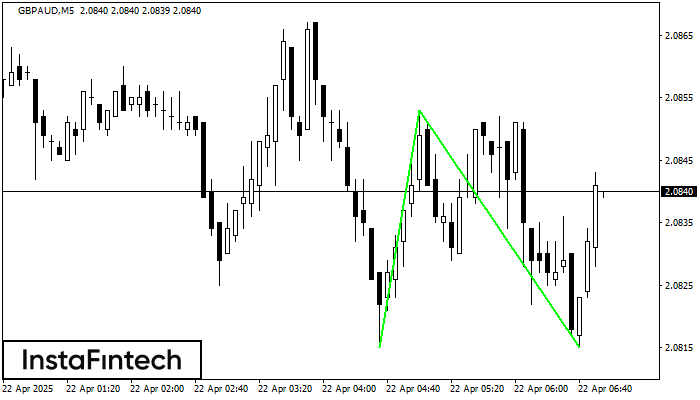
The Double Bottom pattern has been formed on GBPAUD M5. Characteristics: the support level 2.0815; the resistance level 2.0853; the width of the pattern 38 points. If the resistance level
The M5 and M15 time frames may have more false entry points.
Open chart in a new window
Double Top
was formed on 22.04 at 04:35:45 (UTC+0)
signal strength 1 of 5

The Double Top reversal pattern has been formed on NZDCHF M5. Characteristics: the upper boundary 0.4869; the lower boundary 0.4861; the width of the pattern is 7 points. Sell trades
The M5 and M15 time frames may have more false entry points.
Open chart in a new window
Bearish Flag
was formed on 22.04 at 04:22:30 (UTC+0)
signal strength 1 of 5

The Bearish Flag pattern has been formed on the chart SILVER M5. Therefore, the downwards trend is likely to continue in the nearest term. As soon as the price breaks
The M5 and M15 time frames may have more false entry points.
Open chart in a new window


