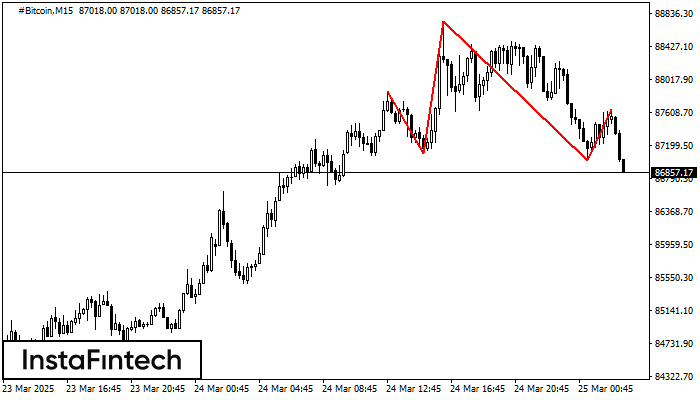
Голова и плечи
сформирован 25.03 в 03:30:30 (UTC+0)
сила сигнала 2 из 5

На графике #Bitcoin M15 сформировалась фигура «Голова и плечи» с характеристикой: Вершина головы 88742.88; Уровень шеи, восходящий угол - 87100.22/87010.53. Формирование данной фигуры может привести к изменению текущей тенденции с восходящей на нисходящую. Вероятно предполагать, что курс #Bitcoin, в случае срабатывания фигуры, пойдет в направлении 87010.30 (15 - 30 пунктов).
Таймфреймы М5 и М15 могут иметь больше ложных точек входа.
Дивіться також
- Все
- Все
- Bearish Rectangle
- Bearish Symmetrical Triangle
- Bearish Symmetrical Triangle
- Bullish Rectangle
- Double Top
- Double Top
- Triple Bottom
- Triple Bottom
- Triple Top
- Triple Top
- Все
- Все
- Покупка
- Продажа
- Все
- 1
- 2
- 3
- 4
- 5
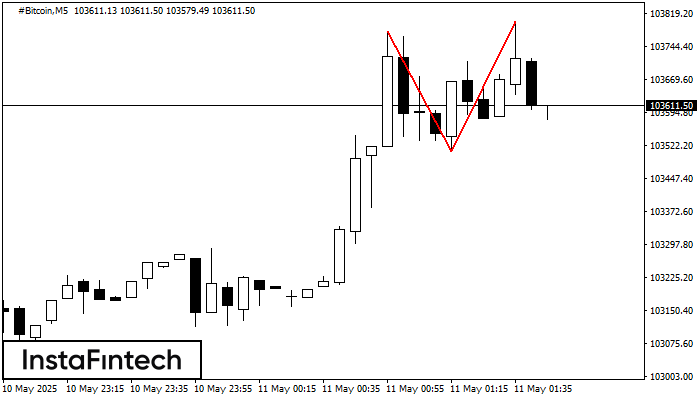
Double Top
сформирован 11.05 в 00:45:18 (UTC+0)
сила сигнала 1 из 5
On the chart of #Bitcoin M5 the Double Top reversal pattern has been formed. Characteristics: the upper boundary 103800.29; the lower boundary 103508.08; the width of the pattern 29221 points
The M5 and M15 time frames may have more false entry points.
Открыть график инструмента в новом окне
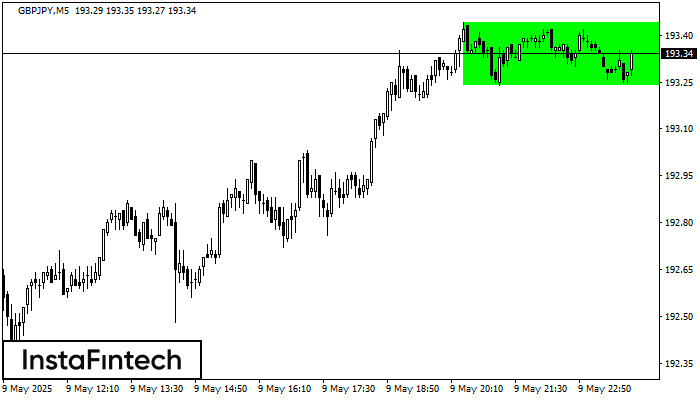
Bullish Rectangle
сформирован 09.05 в 22:57:29 (UTC+0)
сила сигнала 1 из 5
According to the chart of M5, GBPJPY formed the Bullish Rectangle. The pattern indicates a trend continuation. The upper border is 193.44, the lower border is 193.24. The signal means
The M5 and M15 time frames may have more false entry points.
Открыть график инструмента в новом окне
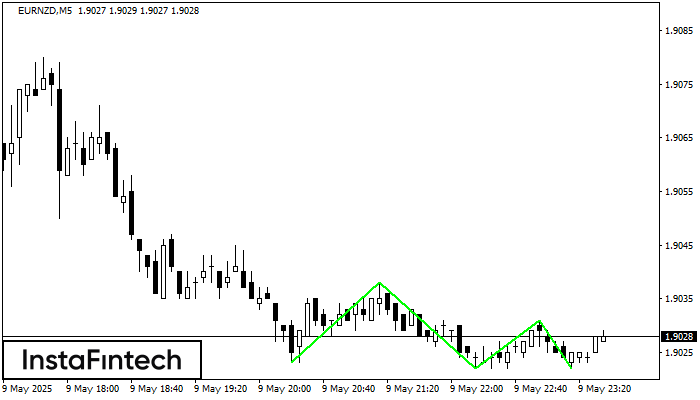
Triple Bottom
сформирован 09.05 в 22:35:52 (UTC+0)
сила сигнала 1 из 5
The Triple Bottom pattern has formed on the chart of the EURNZD M5 trading instrument. The pattern signals a change in the trend from downwards to upwards in the case
The M5 and M15 time frames may have more false entry points.
Открыть график инструмента в новом окне


