

รูปแบบกราฟ

รูปแบบกราฟนั้นเป็น รูปจำลองทางกราฟฟิกที่ถูกสร้างขึ้นมาในชาร์ตจากราคา อ้างอิงตามหนึ่งในการวิเคราะห์ทางเทคนิค ที่ตั้งสมมติฐานมาว่า ประวัติศาสตร์ (การเคลื่อนไหวของราคา) มักจะเกิดขึ้นซ้ำรอยเดิม นั้นหมายความว่า การเคลื่อนไหวของราคาก็หมือนกับ สถานการณ์หนึ่งที่จะสามารถทำการคาดการณ์ไปยังทิศทางในอนาคต ตามเหตุการณ์ที่น่าจะมีความเป็นไปได้สูง
รูปแบบกราฟที่สำคัญจากทาง InstaTrade นั้นจะเป็นการบริการที่มีการใช้อย่างง่ายดาย ซึ่งจะช่วยให้คุณสามารถทราบถึงการเปลี่ยนแปลงล่าสุด ในตลาดได้ และสามารถรับมือกับข้อมูลจากทางตลาดได้ทันท่วงที ในการบริการของพวกเรานั้น คุณจะพบกับรูปแบบกราฟล่าสุดและมีความสำคัญมากที่สุดในทุกๆคู่สกุลเงิน และทุกๆขอบเขตเวลา
Triple Top
was formed on 22.04 at 02:00:16 (UTC+0)
signal strength 3 of 5

The Triple Top pattern has formed on the chart of the EURCAD M30 trading instrument. It is a reversal pattern featuring the following characteristics: resistance level 14, support level -60, and pattern’s width 103. Forecast If the price breaks through the support level 1.5860, it is likely to move further down to 1.5924.
- All
- All
- Bearish Rectangle
- Bearish Symmetrical Triangle
- Bearish Symmetrical Triangle
- Bullish Rectangle
- Double Top
- Double Top
- Triple Bottom
- Triple Bottom
- Triple Top
- Triple Top
- All
- All
- Buy
- Sale
- All
- 1
- 2
- 3
- 4
- 5
Bearish pennant
was formed on 05.05 at 03:42:46 (UTC+0)
signal strength 1 of 5
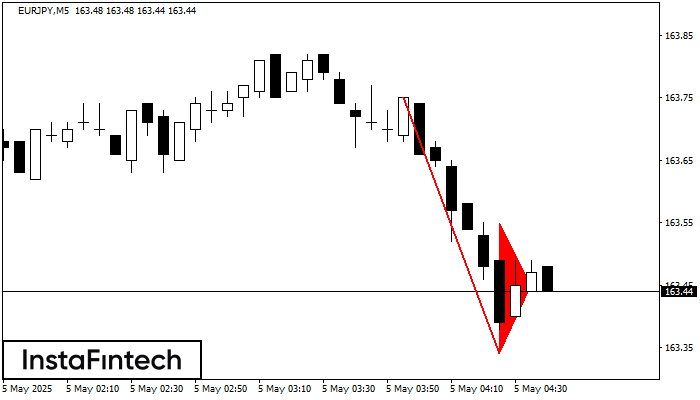
The Bearish pennant pattern has formed on the EURJPY M5 chart. It signals potential continuation of the existing trend. Specifications: the pattern’s bottom has the coordinate of 163.34; the projection
The M5 and M15 time frames may have more false entry points.
Open chart in a new window
Double Bottom
was formed on 05.05 at 02:45:03 (UTC+0)
signal strength 1 of 5
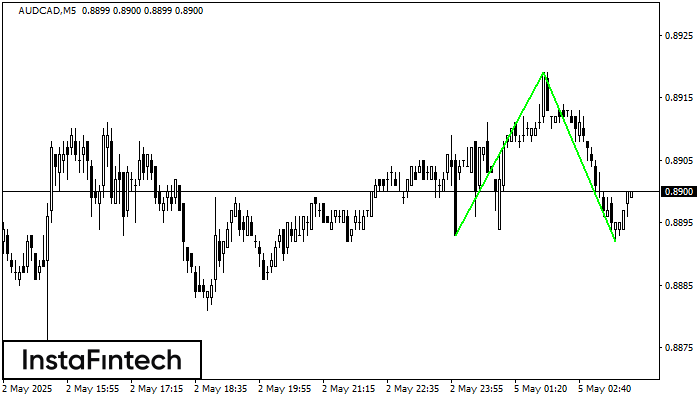
The Double Bottom pattern has been formed on AUDCAD M5. This formation signals a reversal of the trend from downwards to upwards. The signal is that a buy trade should
The M5 and M15 time frames may have more false entry points.
Open chart in a new window
Double Bottom
was formed on 05.05 at 00:30:20 (UTC+0)
signal strength 3 of 5

The Double Bottom pattern has been formed on EURCAD M30. Characteristics: the support level 1.5599; the resistance level 1.5621; the width of the pattern 22 points. If the resistance level
Open chart in a new window


