

รูปแบบกราฟ

รูปแบบกราฟนั้นเป็น รูปจำลองทางกราฟฟิกที่ถูกสร้างขึ้นมาในชาร์ตจากราคา อ้างอิงตามหนึ่งในการวิเคราะห์ทางเทคนิค ที่ตั้งสมมติฐานมาว่า ประวัติศาสตร์ (การเคลื่อนไหวของราคา) มักจะเกิดขึ้นซ้ำรอยเดิม นั้นหมายความว่า การเคลื่อนไหวของราคาก็หมือนกับ สถานการณ์หนึ่งที่จะสามารถทำการคาดการณ์ไปยังทิศทางในอนาคต ตามเหตุการณ์ที่น่าจะมีความเป็นไปได้สูง
รูปแบบกราฟที่สำคัญจากทาง InstaTrade นั้นจะเป็นการบริการที่มีการใช้อย่างง่ายดาย ซึ่งจะช่วยให้คุณสามารถทราบถึงการเปลี่ยนแปลงล่าสุด ในตลาดได้ และสามารถรับมือกับข้อมูลจากทางตลาดได้ทันท่วงที ในการบริการของพวกเรานั้น คุณจะพบกับรูปแบบกราฟล่าสุดและมีความสำคัญมากที่สุดในทุกๆคู่สกุลเงิน และทุกๆขอบเขตเวลา
Bullish Rectangle
was formed on 14.04 at 13:57:45 (UTC+0)
signal strength 1 of 5
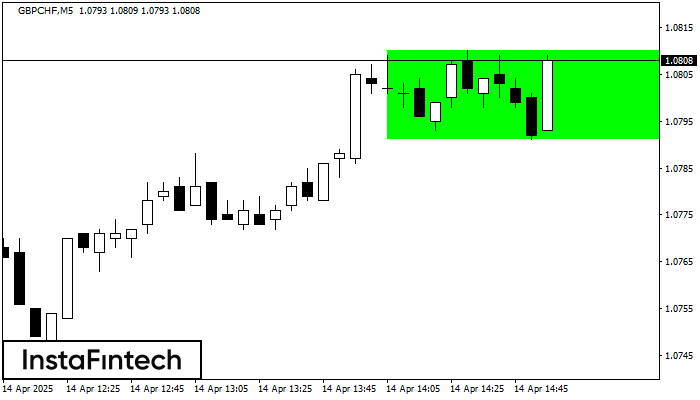
According to the chart of M5, GBPCHF formed the Bullish Rectangle. The pattern indicates a trend continuation. The upper border is 1.0810, the lower border is 1.0791. The signal means that a long position should be opened above the upper border 1.0810 of the Bullish Rectangle.
The M5 and M15 time frames may have more false entry points.
- All
- All
- Bearish Rectangle
- Bearish Symmetrical Triangle
- Bearish Symmetrical Triangle
- Bullish Rectangle
- Double Top
- Double Top
- Triple Bottom
- Triple Bottom
- Triple Top
- Triple Top
- All
- All
- Buy
- Sale
- All
- 1
- 2
- 3
- 4
- 5
Triple Bottom
was formed on 12.05 at 06:35:29 (UTC+0)
signal strength 1 of 5
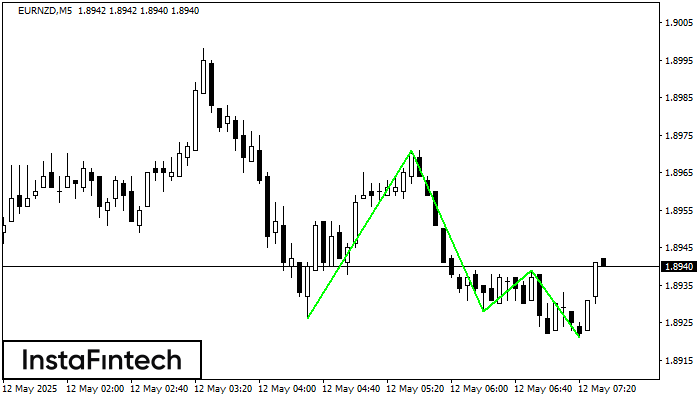
The Triple Bottom pattern has formed on the chart of EURNZD M5. Features of the pattern: The lower line of the pattern has coordinates 1.8971 with the upper limit 1.8971/1.8939
The M5 and M15 time frames may have more false entry points.
Open chart in a new window
Bullish Rectangle
was formed on 12.05 at 06:31:30 (UTC+0)
signal strength 2 of 5
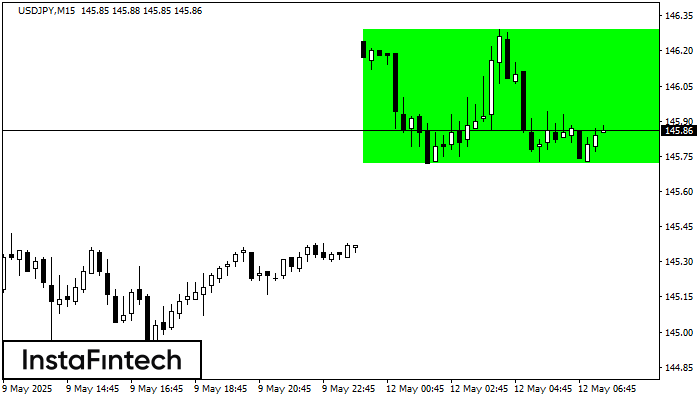
According to the chart of M15, USDJPY formed the Bullish Rectangle. This type of a pattern indicates a trend continuation. It consists of two levels: resistance 146.29 and support 145.72
The M5 and M15 time frames may have more false entry points.
Open chart in a new window
Triple Bottom
was formed on 12.05 at 06:10:15 (UTC+0)
signal strength 1 of 5
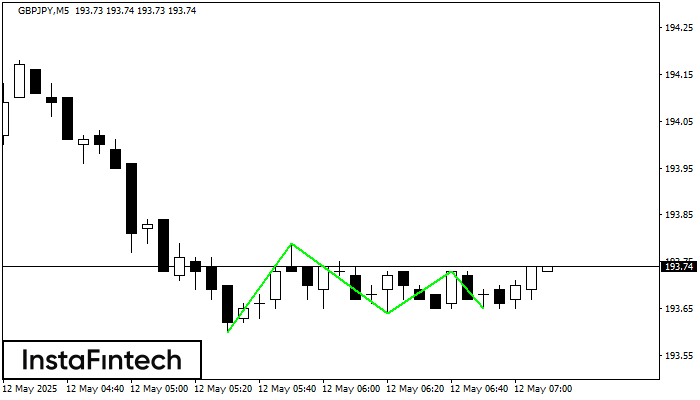
The Triple Bottom pattern has formed on the chart of GBPJPY M5. Features of the pattern: The lower line of the pattern has coordinates 193.79 with the upper limit 193.79/193.73
The M5 and M15 time frames may have more false entry points.
Open chart in a new window


