

รูปแบบกราฟ

รูปแบบกราฟนั้นเป็น รูปจำลองทางกราฟฟิกที่ถูกสร้างขึ้นมาในชาร์ตจากราคา อ้างอิงตามหนึ่งในการวิเคราะห์ทางเทคนิค ที่ตั้งสมมติฐานมาว่า ประวัติศาสตร์ (การเคลื่อนไหวของราคา) มักจะเกิดขึ้นซ้ำรอยเดิม นั้นหมายความว่า การเคลื่อนไหวของราคาก็หมือนกับ สถานการณ์หนึ่งที่จะสามารถทำการคาดการณ์ไปยังทิศทางในอนาคต ตามเหตุการณ์ที่น่าจะมีความเป็นไปได้สูง
รูปแบบกราฟที่สำคัญจากทาง InstaTrade นั้นจะเป็นการบริการที่มีการใช้อย่างง่ายดาย ซึ่งจะช่วยให้คุณสามารถทราบถึงการเปลี่ยนแปลงล่าสุด ในตลาดได้ และสามารถรับมือกับข้อมูลจากทางตลาดได้ทันท่วงที ในการบริการของพวกเรานั้น คุณจะพบกับรูปแบบกราฟล่าสุดและมีความสำคัญมากที่สุดในทุกๆคู่สกุลเงิน และทุกๆขอบเขตเวลา
Double Bottom
was formed on 14.04 at 01:15:08 (UTC+0)
signal strength 1 of 5
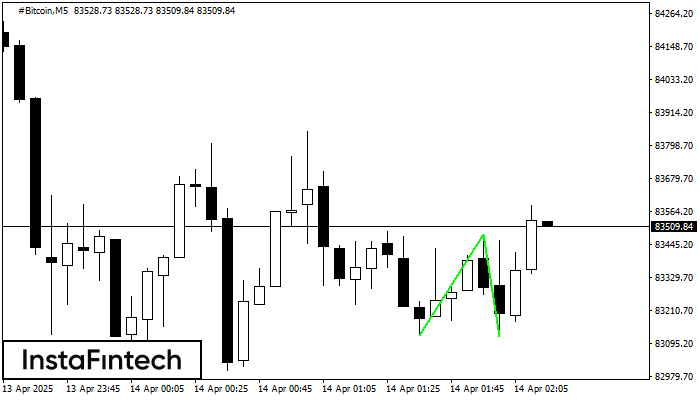
The Double Bottom pattern has been formed on #Bitcoin M5. Characteristics: the support level 83124.20; the resistance level 83483.08; the width of the pattern 35888 points. If the resistance level is broken, a change in the trend can be predicted with the first target point lying at the distance of 36474 points.
The M5 and M15 time frames may have more false entry points.
- All
- All
- Bearish Rectangle
- Bearish Symmetrical Triangle
- Bearish Symmetrical Triangle
- Bullish Rectangle
- Double Top
- Double Top
- Triple Bottom
- Triple Bottom
- Triple Top
- Triple Top
- All
- All
- Buy
- Sale
- All
- 1
- 2
- 3
- 4
- 5
Bearish pennant
was formed on 06.05 at 17:30:46 (UTC+0)
signal strength 3 of 5
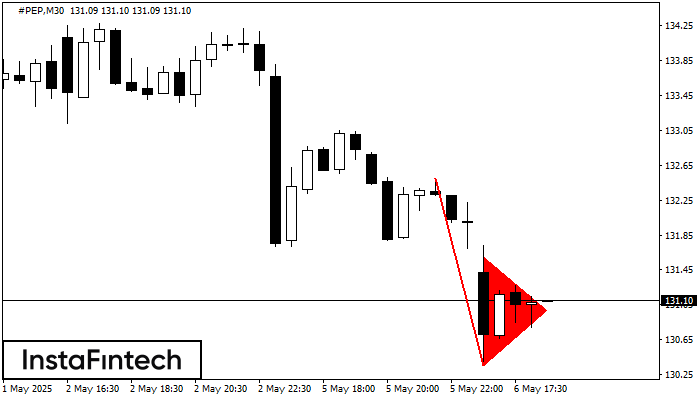
The Bearish pennant pattern has formed on the #PEP M30 chart. It signals potential continuation of the existing trend. Specifications: the pattern’s bottom has the coordinate of 130.36; the projection
Open chart in a new window
Bearish pennant
was formed on 06.05 at 17:30:37 (UTC+0)
signal strength 3 of 5

The Bearish pennant pattern has formed on the #PEP M30 chart. It signals potential continuation of the existing trend. Specifications: the pattern’s bottom has the coordinate of 130.36; the projection
Open chart in a new window
Bearish pennant
was formed on 05.05 at 15:32:00 (UTC+0)
signal strength 3 of 5
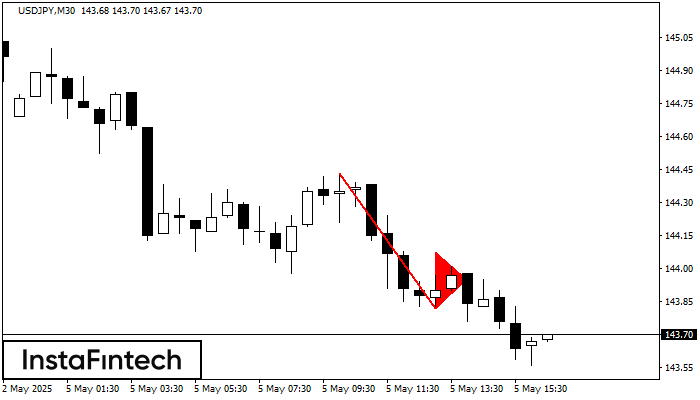
The Bearish pennant pattern has formed on the USDJPY M30 chart. The pattern signals continuation of the downtrend in case the pennant’s low of 143.82 is broken through. Recommendations: Place
Open chart in a new window


