

รูปแบบกราฟ

รูปแบบกราฟนั้นเป็น รูปจำลองทางกราฟฟิกที่ถูกสร้างขึ้นมาในชาร์ตจากราคา อ้างอิงตามหนึ่งในการวิเคราะห์ทางเทคนิค ที่ตั้งสมมติฐานมาว่า ประวัติศาสตร์ (การเคลื่อนไหวของราคา) มักจะเกิดขึ้นซ้ำรอยเดิม นั้นหมายความว่า การเคลื่อนไหวของราคาก็หมือนกับ สถานการณ์หนึ่งที่จะสามารถทำการคาดการณ์ไปยังทิศทางในอนาคต ตามเหตุการณ์ที่น่าจะมีความเป็นไปได้สูง
รูปแบบกราฟที่สำคัญจากทาง InstaTrade นั้นจะเป็นการบริการที่มีการใช้อย่างง่ายดาย ซึ่งจะช่วยให้คุณสามารถทราบถึงการเปลี่ยนแปลงล่าสุด ในตลาดได้ และสามารถรับมือกับข้อมูลจากทางตลาดได้ทันท่วงที ในการบริการของพวกเรานั้น คุณจะพบกับรูปแบบกราฟล่าสุดและมีความสำคัญมากที่สุดในทุกๆคู่สกุลเงิน และทุกๆขอบเขตเวลา
Triple Bottom
was formed on 08.04 at 06:45:21 (UTC+0)
signal strength 1 of 5
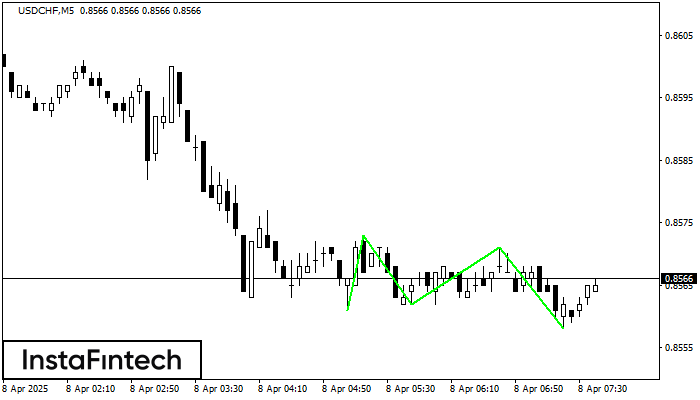
The Triple Bottom pattern has formed on the chart of the USDCHF M5 trading instrument. The pattern signals a change in the trend from downwards to upwards in the case of breakdown of 0.8573/0.8571.
The M5 and M15 time frames may have more false entry points.
- All
- All
- Bearish Rectangle
- Bearish Symmetrical Triangle
- Bearish Symmetrical Triangle
- Bullish Rectangle
- Double Top
- Double Top
- Triple Bottom
- Triple Bottom
- Triple Top
- Triple Top
- All
- All
- Buy
- Sale
- All
- 1
- 2
- 3
- 4
- 5
Double Top
сформирован 12.05 в 22:00:17 (UTC+0)
сила сигнала 3 из 5
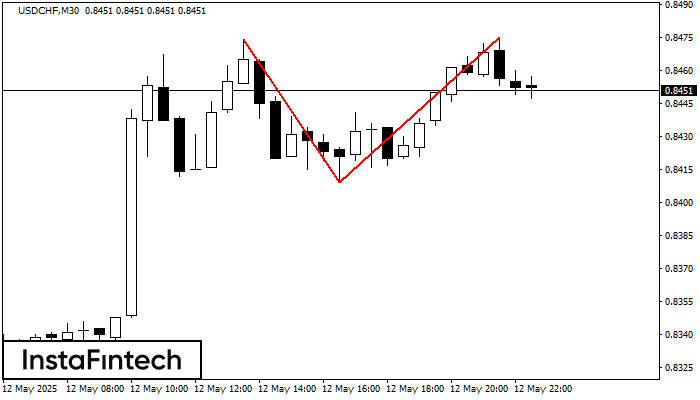
On the chart of USDCHF M30 the Double Top reversal pattern has been formed. Characteristics: the upper boundary 0.8475; the lower boundary 0.8409; the width of the pattern 66 points
Открыть график инструмента в новом окне
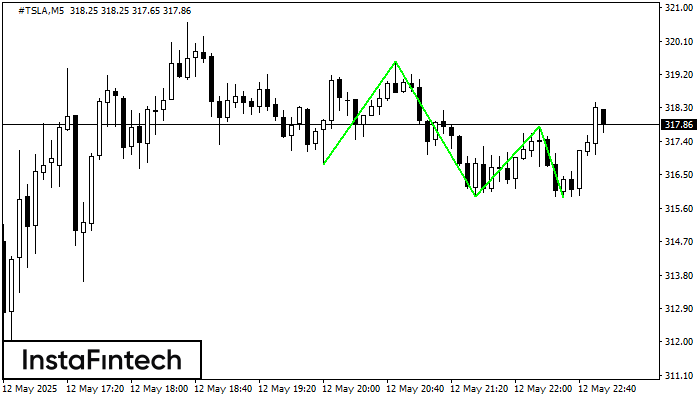
Triple Bottom
сформирован 12.05 в 21:55:25 (UTC+0)
сила сигнала 1 из 5

The Triple Bottom pattern has been formed on #TSLA M5. It has the following characteristics: resistance level 319.55/317.80; support level 316.79/315.89; the width is 276 points. In the event
The M5 and M15 time frames may have more false entry points.
Открыть график инструмента в новом окне
Triple Bottom
сформирован 12.05 в 21:55:11 (UTC+0)
сила сигнала 1 из 5
The Triple Bottom pattern has formed on the chart of #TSLA M5. Features of the pattern: The lower line of the pattern has coordinates 319.55 with the upper limit 319.55/317.80
The M5 and M15 time frames may have more false entry points.
Открыть график инструмента в новом окне


