

รูปแบบกราฟ

รูปแบบกราฟนั้นเป็น รูปจำลองทางกราฟฟิกที่ถูกสร้างขึ้นมาในชาร์ตจากราคา อ้างอิงตามหนึ่งในการวิเคราะห์ทางเทคนิค ที่ตั้งสมมติฐานมาว่า ประวัติศาสตร์ (การเคลื่อนไหวของราคา) มักจะเกิดขึ้นซ้ำรอยเดิม นั้นหมายความว่า การเคลื่อนไหวของราคาก็หมือนกับ สถานการณ์หนึ่งที่จะสามารถทำการคาดการณ์ไปยังทิศทางในอนาคต ตามเหตุการณ์ที่น่าจะมีความเป็นไปได้สูง
รูปแบบกราฟที่สำคัญจากทาง InstaTrade นั้นจะเป็นการบริการที่มีการใช้อย่างง่ายดาย ซึ่งจะช่วยให้คุณสามารถทราบถึงการเปลี่ยนแปลงล่าสุด ในตลาดได้ และสามารถรับมือกับข้อมูลจากทางตลาดได้ทันท่วงที ในการบริการของพวกเรานั้น คุณจะพบกับรูปแบบกราฟล่าสุดและมีความสำคัญมากที่สุดในทุกๆคู่สกุลเงิน และทุกๆขอบเขตเวลา
Bearish Symmetrical Triangle
was formed on 07.04 at 22:29:21 (UTC+0)
signal strength 1 of 5
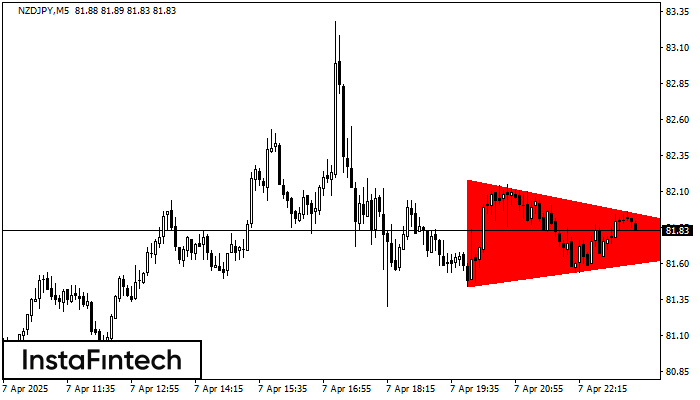
According to the chart of M5, NZDJPY formed the Bearish Symmetrical Triangle pattern. This pattern signals a further downward trend in case the lower border 81.44 is breached. Here, a hypothetical profit will equal the width of the available pattern that is -75 pips.
The M5 and M15 time frames may have more false entry points.
ดูเพิ่มเติม
- All
- All
- Bearish Rectangle
- Bearish Symmetrical Triangle
- Bearish Symmetrical Triangle
- Bullish Rectangle
- Double Top
- Double Top
- Triple Bottom
- Triple Bottom
- Triple Top
- Triple Top
- All
- All
- Buy
- Sale
- All
- 1
- 2
- 3
- 4
- 5
รูปแบบสามเหลี่ยมสมมาตรขาลง (Bearish Symmetrical Triangle)
was formed on 08.05 at 00:20:32 (UTC+0)
signal strength 1 of 5
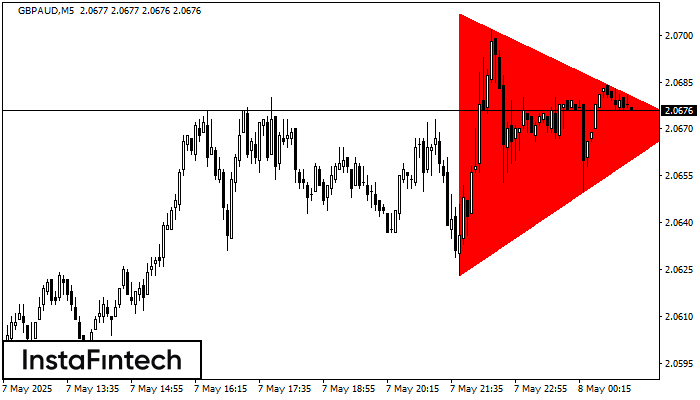
อ้างอิงจากชาร์ตของ M5, GBPAUD ที่ได้สร้างรูปแบบ รูปแบบสามเหลี่ยมสมมาตรขาลง (Bearish Symmetrical Triangle) ออกมา สำหรับคำแนะนำการซื้อขาย คือ การเคลื่อนตัวทะลุผ่านขอบเขตในด้านล่าง 2.0623 อาจจะช่วยสนับสนุนต่อแนวโน้มขาลงอย่างต่อเนื่อง
ขอบเตระยะเวลาใน M5 และ M15 อาจจะมีตำแหน่งการเข้าใช้งานที่ผิดพลาดมากยิ่งขึ้น
Open chart in a new window
รูปแบบกราฟจุดสองยอดขาลง (Double Bottom)
was formed on 08.05 at 00:05:16 (UTC+0)
signal strength 1 of 5
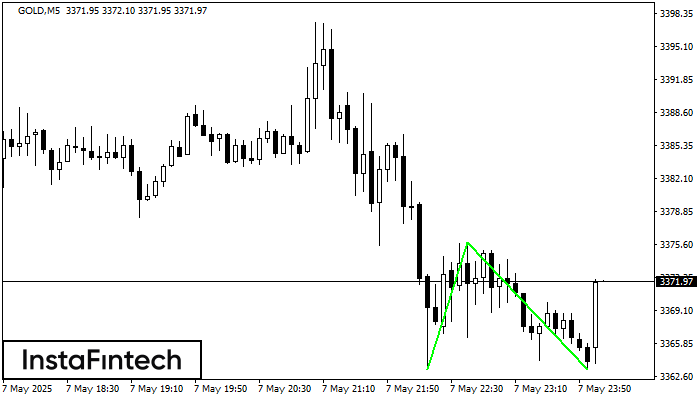
รูปแบบ รูปแบบกราฟจุดสองยอดขาลง (Double Bottom) ถูกสร้างขึ้นมาใน GOLD M5; ขอบเขตด้านบนอยู่ที่ 3375.87;ขอบเขตด้านล่าง คือ 3363.32 ความกว้างของรูปแบบนี้คือ 1258 จุด กรณีที่มีการเคลื่อนตัวทะลุผ่านขอบเขตด้านบน
ขอบเตระยะเวลาใน M5 และ M15 อาจจะมีตำแหน่งการเข้าใช้งานที่ผิดพลาดมากยิ่งขึ้น
Open chart in a new window
รูปแบบกราฟจุดสามยอดขาลง (Triple Bottom)
was formed on 07.05 at 23:25:32 (UTC+0)
signal strength 1 of 5
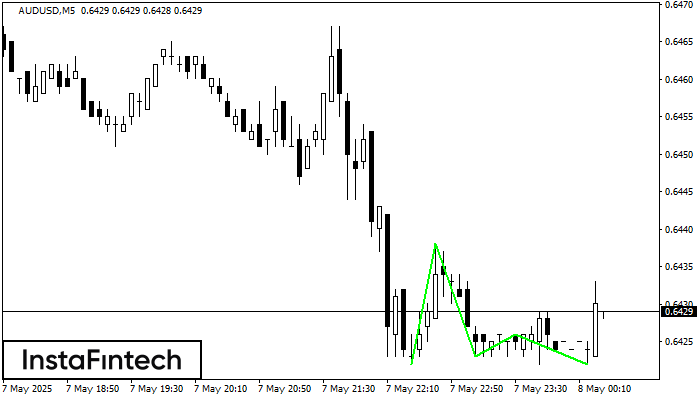
รูปแบบ รูปแบบกราฟจุดสามยอดขาลง (Triple Bottom) ได้สร้างขึ้นมาในชาร์ตของ AUDUSD M5 ลักษณะของกราฟรูปแบบนี้: เส้นด้านล่างของกราฟรูปแบบนี้มีพิกัดอยู่ที่ 0.6438 พร้อมกับลิมิตด้านบน 0.6438/0.6426,ระยะของความกว้างคือ 16 จุด การก่อตัวของกราฟรูปแบบ
ขอบเตระยะเวลาใน M5 และ M15 อาจจะมีตำแหน่งการเข้าใช้งานที่ผิดพลาดมากยิ่งขึ้น
Open chart in a new window


