

รูปแบบกราฟ

รูปแบบกราฟนั้นเป็น รูปจำลองทางกราฟฟิกที่ถูกสร้างขึ้นมาในชาร์ตจากราคา อ้างอิงตามหนึ่งในการวิเคราะห์ทางเทคนิค ที่ตั้งสมมติฐานมาว่า ประวัติศาสตร์ (การเคลื่อนไหวของราคา) มักจะเกิดขึ้นซ้ำรอยเดิม นั้นหมายความว่า การเคลื่อนไหวของราคาก็หมือนกับ สถานการณ์หนึ่งที่จะสามารถทำการคาดการณ์ไปยังทิศทางในอนาคต ตามเหตุการณ์ที่น่าจะมีความเป็นไปได้สูง
รูปแบบกราฟที่สำคัญจากทาง InstaTrade นั้นจะเป็นการบริการที่มีการใช้อย่างง่ายดาย ซึ่งจะช่วยให้คุณสามารถทราบถึงการเปลี่ยนแปลงล่าสุด ในตลาดได้ และสามารถรับมือกับข้อมูลจากทางตลาดได้ทันท่วงที ในการบริการของพวกเรานั้น คุณจะพบกับรูปแบบกราฟล่าสุดและมีความสำคัญมากที่สุดในทุกๆคู่สกุลเงิน และทุกๆขอบเขตเวลา
Triple Top
was formed on 01.04 at 19:30:14 (UTC+0)
signal strength 1 of 5
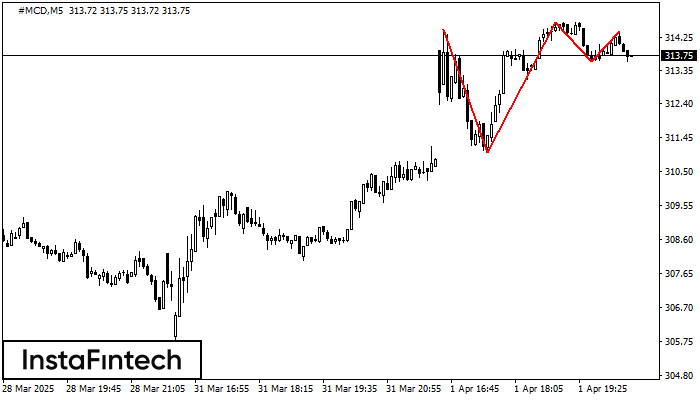
On the chart of the #MCD M5 trading instrument, the Triple Top pattern that signals a trend change has formed. It is possible that after formation of the third peak, the price will try to break through the resistance level 311.03, where we advise to open a trading position for sale. Take profit is the projection of the pattern’s width, which is 345 points.
The M5 and M15 time frames may have more false entry points.
- All
- All
- Bearish Rectangle
- Bearish Symmetrical Triangle
- Bearish Symmetrical Triangle
- Bullish Rectangle
- Double Top
- Double Top
- Triple Bottom
- Triple Bottom
- Triple Top
- Triple Top
- All
- All
- Buy
- Sale
- All
- 1
- 2
- 3
- 4
- 5
รูปแบบกราฟจุดสองยอดขาลง (Double Bottom)
was formed on 10.04 at 01:30:34 (UTC+0)
signal strength 3 of 5
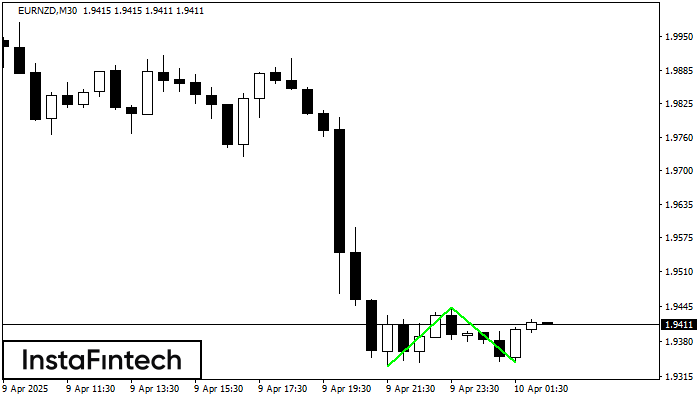
รูปแบบ รูปแบบกราฟจุดสองยอดขาลง (Double Bottom) ถูกสร้างขึ้นมาใน EURNZD M30 การก่อตัวเช่นนี้แสดงถึงการย้อนตัวของแนวโน้มจากด้านล่าง ขึ้นมายังด้านบน สัญญาณแสดงให้เห็นถึง การเทรดแบบการซื้อที่ควรเปิด หลังจากที่มีการเคลื่อนตัวทะลุผ่านขอบเขตด้านบนของรูปแบบ 1.9443 การเคลื่อนไหวต่อจากนั้นจะอยู่ในความกว้างของรูปแบบปัจจุบัน
Open chart in a new window
รูปแบบกราฟสี่เหลี่ยมผืนผ้าขาขึ้น (Bullish Rectangle)
was formed on 10.04 at 01:02:06 (UTC+0)
signal strength 1 of 5
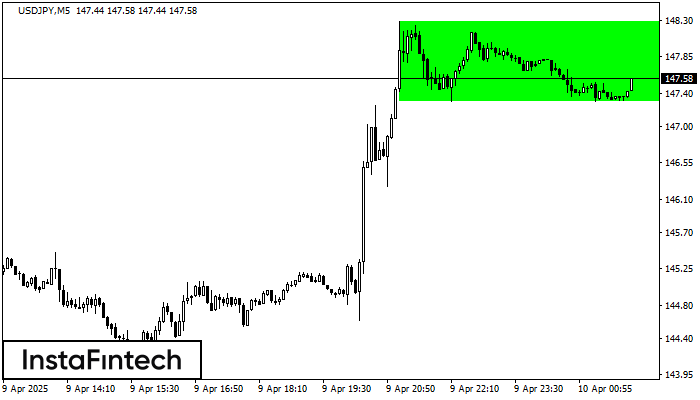
อ้างอิงจากชาร์ตของ M5, USDJPY ที่ได้สร้างรูปแบบ รูปแบบกราฟสี่เหลี่ยมผืนผ้าขาขึ้น (Bullish Rectangle) ออกมา รูปแบบประเภทนี้แสดงถึง ความต่อเนื่องในแนวโน้ม มันประกอบไปด้วยสองระดับ: แนวต้าน 148.28 และแนวรับ 147.30
ขอบเตระยะเวลาใน M5 และ M15 อาจจะมีตำแหน่งการเข้าใช้งานที่ผิดพลาดมากยิ่งขึ้น
Open chart in a new window
รูปแบบกราฟจุดสามยอดขาลง (Triple Bottom)
was formed on 10.04 at 01:00:34 (UTC+0)
signal strength 2 of 5
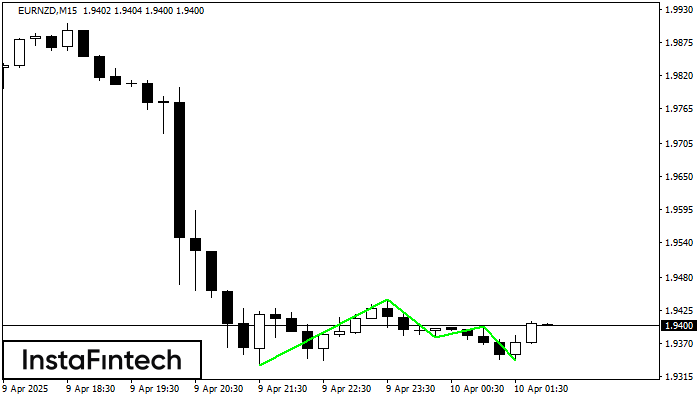
รูปแบบ รูปแบบกราฟจุดสามยอดขาลง (Triple Bottom) ได้สร้างขึ้นมาในชาร์ตของ EURNZD M15 ลักษณะของกราฟรูปแบบนี้: เส้นด้านล่างของกราฟรูปแบบนี้มีพิกัดอยู่ที่ 1.9443 พร้อมกับลิมิตด้านบน 1.9443/1.9398,ระยะของความกว้างคือ 110 จุด การก่อตัวของกราฟรูปแบบ
ขอบเตระยะเวลาใน M5 และ M15 อาจจะมีตำแหน่งการเข้าใช้งานที่ผิดพลาดมากยิ่งขึ้น
Open chart in a new window


