

รูปแบบกราฟ

รูปแบบกราฟนั้นเป็น รูปจำลองทางกราฟฟิกที่ถูกสร้างขึ้นมาในชาร์ตจากราคา อ้างอิงตามหนึ่งในการวิเคราะห์ทางเทคนิค ที่ตั้งสมมติฐานมาว่า ประวัติศาสตร์ (การเคลื่อนไหวของราคา) มักจะเกิดขึ้นซ้ำรอยเดิม นั้นหมายความว่า การเคลื่อนไหวของราคาก็หมือนกับ สถานการณ์หนึ่งที่จะสามารถทำการคาดการณ์ไปยังทิศทางในอนาคต ตามเหตุการณ์ที่น่าจะมีความเป็นไปได้สูง
รูปแบบกราฟที่สำคัญจากทาง InstaTrade นั้นจะเป็นการบริการที่มีการใช้อย่างง่ายดาย ซึ่งจะช่วยให้คุณสามารถทราบถึงการเปลี่ยนแปลงล่าสุด ในตลาดได้ และสามารถรับมือกับข้อมูลจากทางตลาดได้ทันท่วงที ในการบริการของพวกเรานั้น คุณจะพบกับรูปแบบกราฟล่าสุดและมีความสำคัญมากที่สุดในทุกๆคู่สกุลเงิน และทุกๆขอบเขตเวลา
Bearish Symmetrical Triangle
was formed on 01.04 at 07:59:27 (UTC+0)
signal strength 1 of 5
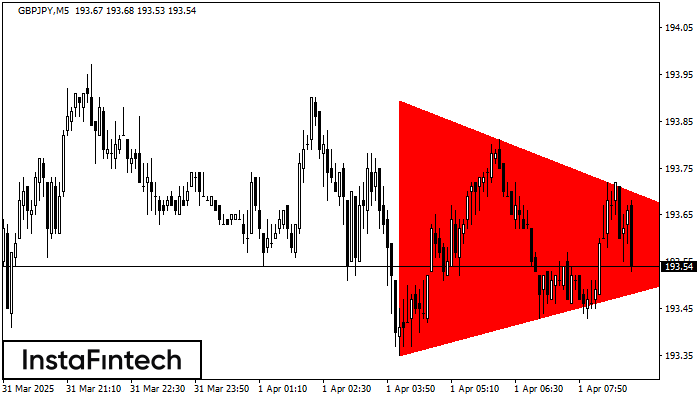
According to the chart of M5, GBPJPY formed the Bearish Symmetrical Triangle pattern. Description: The lower border is 193.35/193.57 and upper border is 193.89/193.57. The pattern width is measured on the chart at -54 pips. The formation of the Bearish Symmetrical Triangle pattern evidently signals a continuation of the downward trend. In other words, if the scenario comes true and GBPJPY breaches the lower border, the price could continue its move toward 193.42.
The M5 and M15 time frames may have more false entry points.
- All
- All
- Bearish Rectangle
- Bearish Symmetrical Triangle
- Bearish Symmetrical Triangle
- Bullish Rectangle
- Double Top
- Double Top
- Triple Bottom
- Triple Bottom
- Triple Top
- Triple Top
- All
- All
- Buy
- Sale
- All
- 1
- 2
- 3
- 4
- 5
Bearish Symmetrical Triangle
was formed on 13.05 at 21:54:58 (UTC+0)
signal strength 2 of 5
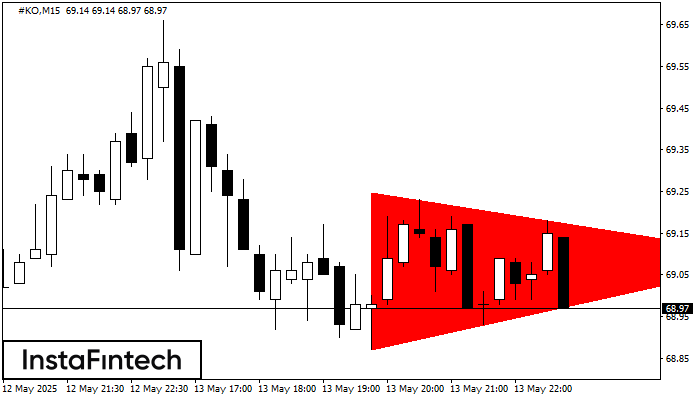
According to the chart of M15, #KO formed the Bearish Symmetrical Triangle pattern. Description: The lower border is 68.87/69.09 and upper border is 69.25/69.09. The pattern width is measured
The M5 and M15 time frames may have more false entry points.
Open chart in a new window
Bearish Symmetrical Triangle
was formed on 13.05 at 21:53:19 (UTC+0)
signal strength 1 of 5
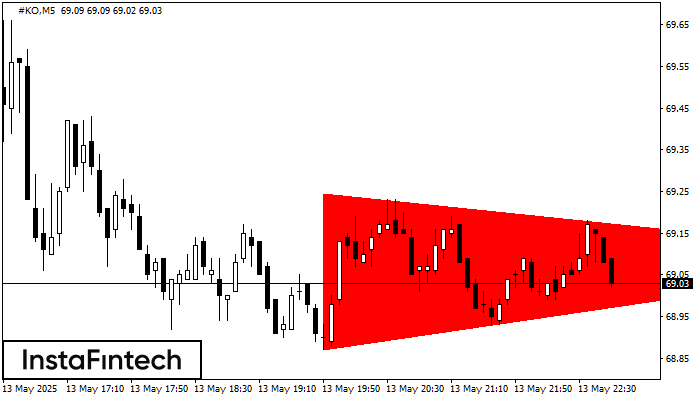
According to the chart of M5, #KO formed the Bearish Symmetrical Triangle pattern. Trading recommendations: A breach of the lower border 68.87 is likely to encourage a continuation
The M5 and M15 time frames may have more false entry points.
Open chart in a new window
Bullish pennant
was formed on 13.05 at 21:30:25 (UTC+0)
signal strength 4 of 5
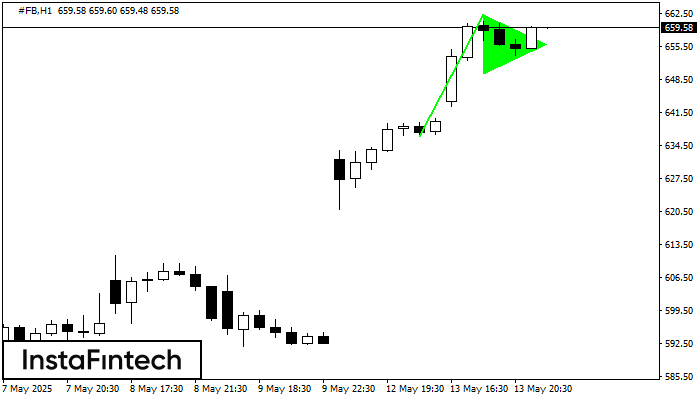
The Bullish pennant signal – Trading instrument #FB H1, continuation pattern. Forecast: it is possible to set up a buy position above the pattern’s high of 662.37, with the prospect
Open chart in a new window


