

รูปแบบกราฟ

รูปแบบกราฟนั้นเป็น รูปจำลองทางกราฟฟิกที่ถูกสร้างขึ้นมาในชาร์ตจากราคา อ้างอิงตามหนึ่งในการวิเคราะห์ทางเทคนิค ที่ตั้งสมมติฐานมาว่า ประวัติศาสตร์ (การเคลื่อนไหวของราคา) มักจะเกิดขึ้นซ้ำรอยเดิม นั้นหมายความว่า การเคลื่อนไหวของราคาก็หมือนกับ สถานการณ์หนึ่งที่จะสามารถทำการคาดการณ์ไปยังทิศทางในอนาคต ตามเหตุการณ์ที่น่าจะมีความเป็นไปได้สูง
รูปแบบกราฟที่สำคัญจากทาง InstaTrade นั้นจะเป็นการบริการที่มีการใช้อย่างง่ายดาย ซึ่งจะช่วยให้คุณสามารถทราบถึงการเปลี่ยนแปลงล่าสุด ในตลาดได้ และสามารถรับมือกับข้อมูลจากทางตลาดได้ทันท่วงที ในการบริการของพวกเรานั้น คุณจะพบกับรูปแบบกราฟล่าสุดและมีความสำคัญมากที่สุดในทุกๆคู่สกุลเงิน และทุกๆขอบเขตเวลา
Triple Bottom
was formed on 28.03 at 20:05:31 (UTC+0)
signal strength 1 of 5
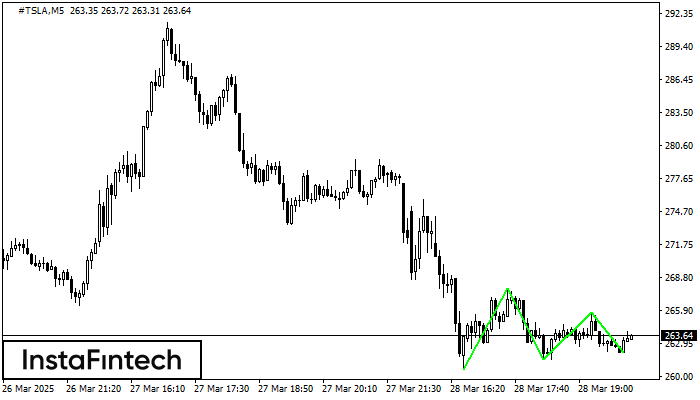
The Triple Bottom pattern has been formed on #TSLA M5. It has the following characteristics: resistance level 267.82/265.73; support level 260.65/262.15; the width is 717 points. In the event of a breakdown of the resistance level of 267.82, the price is likely to continue an upward movement at least to 261.68.
The M5 and M15 time frames may have more false entry points.
- All
- All
- Bearish Rectangle
- Bearish Symmetrical Triangle
- Bearish Symmetrical Triangle
- Bullish Rectangle
- Double Top
- Double Top
- Triple Bottom
- Triple Bottom
- Triple Top
- Triple Top
- All
- All
- Buy
- Sale
- All
- 1
- 2
- 3
- 4
- 5
Double Bottom
сформирован 09.05 в 20:55:26 (UTC+0)
сила сигнала 1 из 5
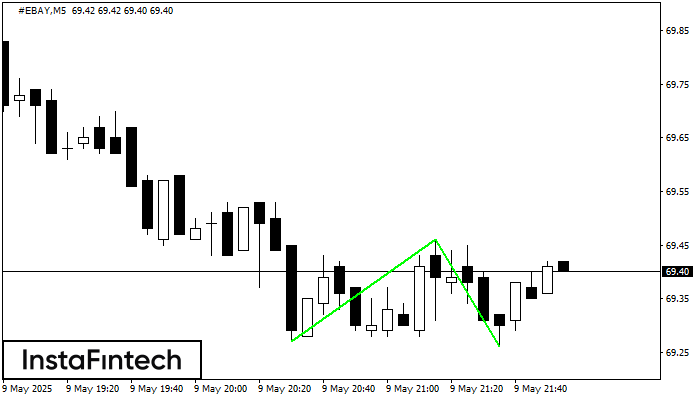
The Double Bottom pattern has been formed on #EBAY M5. Characteristics: the support level 69.27; the resistance level 69.46; the width of the pattern 19 points. If the resistance level
The M5 and M15 time frames may have more false entry points.
Открыть график инструмента в новом окне
Bullish Symmetrical Triangle
сформирован 09.05 в 20:51:50 (UTC+0)
сила сигнала 1 из 5
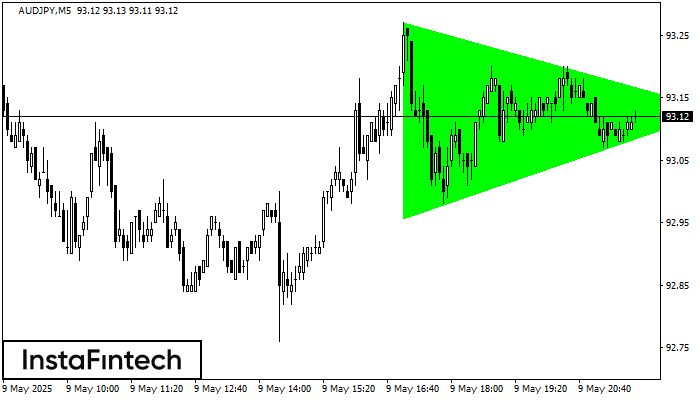
According to the chart of M5, AUDJPY formed the Bullish Symmetrical Triangle pattern. Description: This is the pattern of a trend continuation. 93.27 and 92.96 are the coordinates
The M5 and M15 time frames may have more false entry points.
Открыть график инструмента в новом окне
Bearish Symmetrical Triangle
сформирован 09.05 в 20:17:44 (UTC+0)
сила сигнала 1 из 5
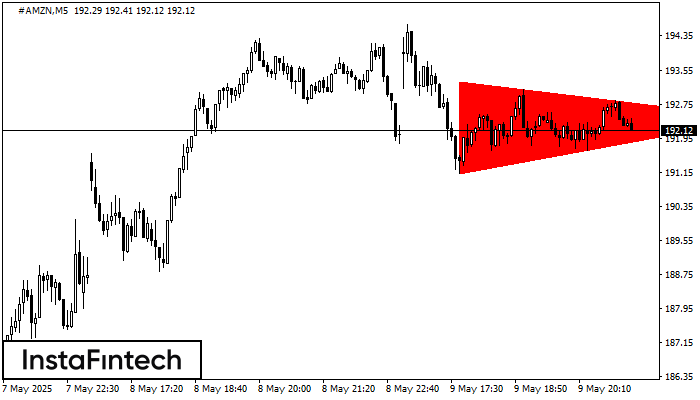
According to the chart of M5, #AMZN formed the Bearish Symmetrical Triangle pattern. Trading recommendations: A breach of the lower border 191.13 is likely to encourage a continuation
The M5 and M15 time frames may have more false entry points.
Открыть график инструмента в новом окне


