

รูปแบบกราฟ

รูปแบบกราฟนั้นเป็น รูปจำลองทางกราฟฟิกที่ถูกสร้างขึ้นมาในชาร์ตจากราคา อ้างอิงตามหนึ่งในการวิเคราะห์ทางเทคนิค ที่ตั้งสมมติฐานมาว่า ประวัติศาสตร์ (การเคลื่อนไหวของราคา) มักจะเกิดขึ้นซ้ำรอยเดิม นั้นหมายความว่า การเคลื่อนไหวของราคาก็หมือนกับ สถานการณ์หนึ่งที่จะสามารถทำการคาดการณ์ไปยังทิศทางในอนาคต ตามเหตุการณ์ที่น่าจะมีความเป็นไปได้สูง
รูปแบบกราฟที่สำคัญจากทาง InstaTrade นั้นจะเป็นการบริการที่มีการใช้อย่างง่ายดาย ซึ่งจะช่วยให้คุณสามารถทราบถึงการเปลี่ยนแปลงล่าสุด ในตลาดได้ และสามารถรับมือกับข้อมูลจากทางตลาดได้ทันท่วงที ในการบริการของพวกเรานั้น คุณจะพบกับรูปแบบกราฟล่าสุดและมีความสำคัญมากที่สุดในทุกๆคู่สกุลเงิน และทุกๆขอบเขตเวลา
Triple Top
was formed on 24.03 at 23:01:00 (UTC+0)
signal strength 1 of 5

The Triple Top pattern has formed on the chart of the EURJPY M5. Features of the pattern: borders have an ascending angle; the lower line of the pattern has the coordinates 162.59/162.72 with the upper limit 162.78/162.77; the projection of the width is 19 points. The formation of the Triple Top figure most likely indicates a change in the trend from upward to downward. This means that in the event of a breakdown of the support level of 162.59, the price is most likely to continue the downward movement.
The M5 and M15 time frames may have more false entry points.
- All
- All
- Bearish Rectangle
- Bearish Symmetrical Triangle
- Bearish Symmetrical Triangle
- Bullish Rectangle
- Double Top
- Double Top
- Triple Bottom
- Triple Bottom
- Triple Top
- Triple Top
- All
- All
- Buy
- Sale
- All
- 1
- 2
- 3
- 4
- 5
รูปแบบกราฟจุดสามยอดขาลง (Triple Bottom)
was formed on 08.05 at 12:20:35 (UTC+0)
signal strength 1 of 5

รูปแบบ รูปแบบกราฟจุดสามยอดขาลง (Triple Bottom) ได้สร้างขึ้นมาในชาร์ตของ GBPCHF M5 ลักษณะของกราฟรูปแบบนี้: เส้นด้านล่างของกราฟรูปแบบนี้มีพิกัดอยู่ที่ 1.0970 พร้อมกับลิมิตด้านบน 1.0970/1.0964,ระยะของความกว้างคือ 14 จุด การก่อตัวของกราฟรูปแบบ
ขอบเตระยะเวลาใน M5 และ M15 อาจจะมีตำแหน่งการเข้าใช้งานที่ผิดพลาดมากยิ่งขึ้น
Open chart in a new window
รูปแบบกราฟธงขาขึ้น (Bullish Flag)
was formed on 08.05 at 12:10:56 (UTC+0)
signal strength 2 of 5

รูปแบบ รูปแบบกราฟธงขาขึ้น (Bullish Flag) ได้สร้างขึ้นมาใน EURJPY ที่ M15 ขอบเขตด้านล่างของรูปแบบนี้จะอยู่ใน 163.36/163.14 ซึ่งขอบเขตด้านบนอยู่ใน 163.60/163.38 ส่วนตัวของเสาธงอยู่ใน 62 จุด
ขอบเตระยะเวลาใน M5 และ M15 อาจจะมีตำแหน่งการเข้าใช้งานที่ผิดพลาดมากยิ่งขึ้น
Open chart in a new window
รูปแบบกราฟธงปลายแหลมขาขึ้น (Bullish pennant)
was formed on 08.05 at 12:10:51 (UTC+0)
signal strength 2 of 5
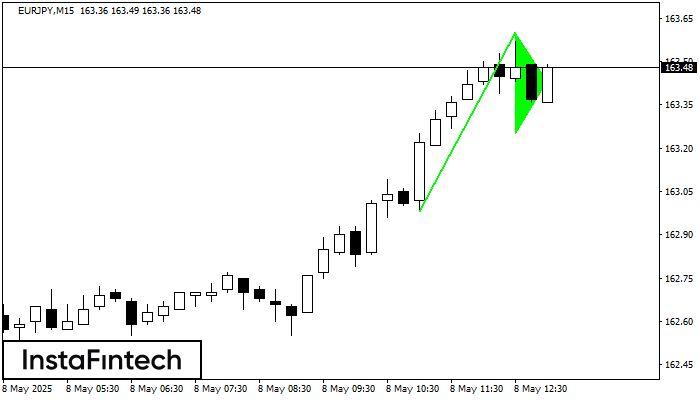
รูปแบบกราฟิก รูปแบบกราฟธงปลายแหลมขาขึ้น (Bullish pennant) ได้สร้างขึ้นมาในตราสาร EURJPY M15 รูปแบบประเภทนี้จะอยู่ใน ประเภทของรูปแบบต่อเนื่อง ในกรณีเช่นนี้ ถ้าหากมูลค่าสามารถเคลื่อนตัวทะลุผ่านระดับสูงออกไปได้ ก็คาดการณ์ว่าจะยังเคลื่อนตัวไปยังแนวโน้มขาขึ้นที่ระดับ 163.82
ขอบเตระยะเวลาใน M5 และ M15 อาจจะมีตำแหน่งการเข้าใช้งานที่ผิดพลาดมากยิ่งขึ้น
Open chart in a new window


