

รูปแบบกราฟ

รูปแบบกราฟนั้นเป็น รูปจำลองทางกราฟฟิกที่ถูกสร้างขึ้นมาในชาร์ตจากราคา อ้างอิงตามหนึ่งในการวิเคราะห์ทางเทคนิค ที่ตั้งสมมติฐานมาว่า ประวัติศาสตร์ (การเคลื่อนไหวของราคา) มักจะเกิดขึ้นซ้ำรอยเดิม นั้นหมายความว่า การเคลื่อนไหวของราคาก็หมือนกับ สถานการณ์หนึ่งที่จะสามารถทำการคาดการณ์ไปยังทิศทางในอนาคต ตามเหตุการณ์ที่น่าจะมีความเป็นไปได้สูง
รูปแบบกราฟที่สำคัญจากทาง InstaTrade นั้นจะเป็นการบริการที่มีการใช้อย่างง่ายดาย ซึ่งจะช่วยให้คุณสามารถทราบถึงการเปลี่ยนแปลงล่าสุด ในตลาดได้ และสามารถรับมือกับข้อมูลจากทางตลาดได้ทันท่วงที ในการบริการของพวกเรานั้น คุณจะพบกับรูปแบบกราฟล่าสุดและมีความสำคัญมากที่สุดในทุกๆคู่สกุลเงิน และทุกๆขอบเขตเวลา
Bullish Symmetrical Triangle
was formed on 24.03 at 23:00:22 (UTC+0)
signal strength 1 of 5
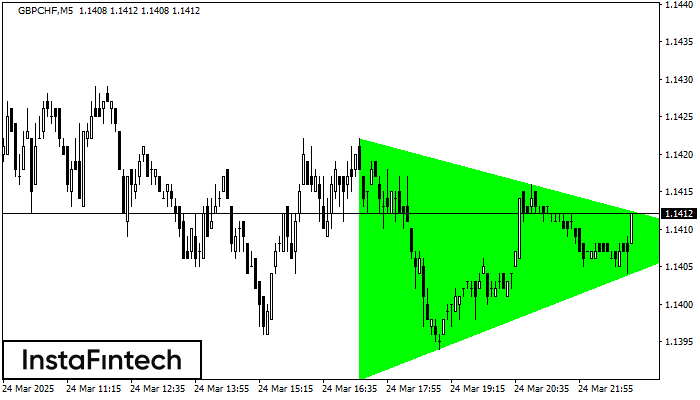
According to the chart of M5, GBPCHF formed the Bullish Symmetrical Triangle pattern. Description: This is the pattern of a trend continuation. 1.1422 and 1.1390 are the coordinates of the upper and lower borders respectively. The pattern width is measured on the chart at 32 pips. Outlook: If the upper border 1.1422 is broken, the price is likely to continue its move by 1.1424.
The M5 and M15 time frames may have more false entry points.
ดูเพิ่มเติม
- All
- All
- Bearish Rectangle
- Bearish Symmetrical Triangle
- Bearish Symmetrical Triangle
- Bullish Rectangle
- Double Top
- Double Top
- Triple Bottom
- Triple Bottom
- Triple Top
- Triple Top
- All
- All
- Buy
- Sale
- All
- 1
- 2
- 3
- 4
- 5
รูปแบบกราฟจุดสองยอด (Double Top)
was formed on 16.05 at 18:10:28 (UTC+0)
signal strength 1 of 5
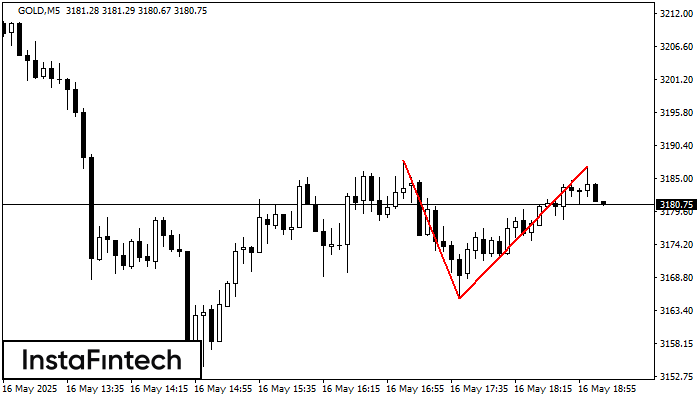
รูปแบบการย้อนตัว รูปแบบกราฟจุดสองยอด (Double Top) ได้ถูกสร้างขึ้นมาใน GOLD M5 คุณลักษณะ: ขอบเขตด้านบน 3187.99; ขอบเขตด้านล่าง 3165.48; ความกว้างของกราฟรูปแบบนี้คือ 2143 จุด
ขอบเตระยะเวลาใน M5 และ M15 อาจจะมีตำแหน่งการเข้าใช้งานที่ผิดพลาดมากยิ่งขึ้น
Open chart in a new window
รูปแบบกราฟจุดสองยอดขาลง (Double Bottom)
was formed on 16.05 at 18:05:25 (UTC+0)
signal strength 1 of 5
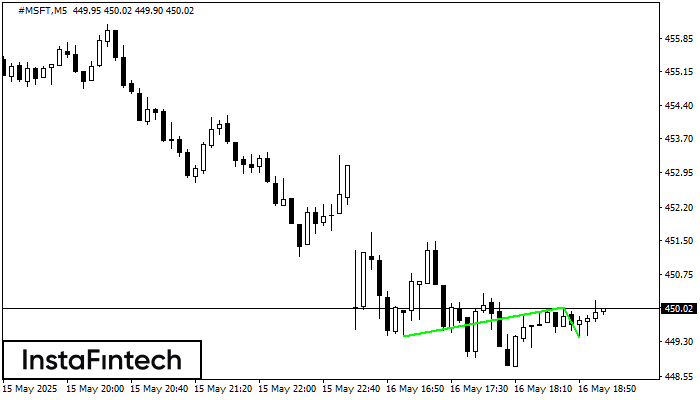
รูปแบบ รูปแบบกราฟจุดสองยอดขาลง (Double Bottom) ถูกสร้างขึ้นมาใน #MSFT M5 การก่อตัวเช่นนี้แสดงถึงการย้อนตัวของแนวโน้มจากด้านล่าง ขึ้นมายังด้านบน สัญญาณแสดงให้เห็นถึง การเทรดแบบการซื้อที่ควรเปิด หลังจากที่มีการเคลื่อนตัวทะลุผ่านขอบเขตด้านบนของรูปแบบ 450.05 การเคลื่อนไหวต่อจากนั้นจะอยู่ในความกว้างของรูปแบบปัจจุบัน
ขอบเตระยะเวลาใน M5 และ M15 อาจจะมีตำแหน่งการเข้าใช้งานที่ผิดพลาดมากยิ่งขึ้น
Open chart in a new window
รูปแบบกราฟจุดสามยอด (Triple Top)
was formed on 16.05 at 17:30:17 (UTC+0)
signal strength 4 of 5
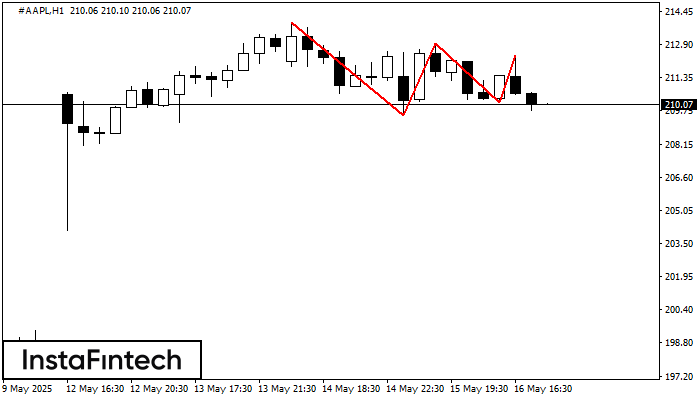
ในชาร์ตของตราสารการซื้อขาย #AAPL H1 กราฟรูปแบบ รูปแบบกราฟจุดสามยอด (Triple Top) ที่แสดงให้เห็นถึง การเปลี่ยนแปลงของแนวโน้มที่ถูกสร้างขึ้นมา มันเป็นไปได้ที่ หลังจากการก่อตัวของระดับสูงสุดอันดับสามมาแล้ว ราคาจะพยายามเคลื่อนตัวทะลุผ่านระดับของแนวต้าน 209.52 ที่พวกเราแนะนำให้เปิดสถานะการเทรดไว้เพื่อเป็นการขาย ตำแหน่งการทำกำไรเป็นระยะทางของความกว้างในกราฟรูปแบบนี้
Open chart in a new window


