อ่านรายละเอียดเพิ่มเติม


 01.07.2024 10:58 AM
Analysis:
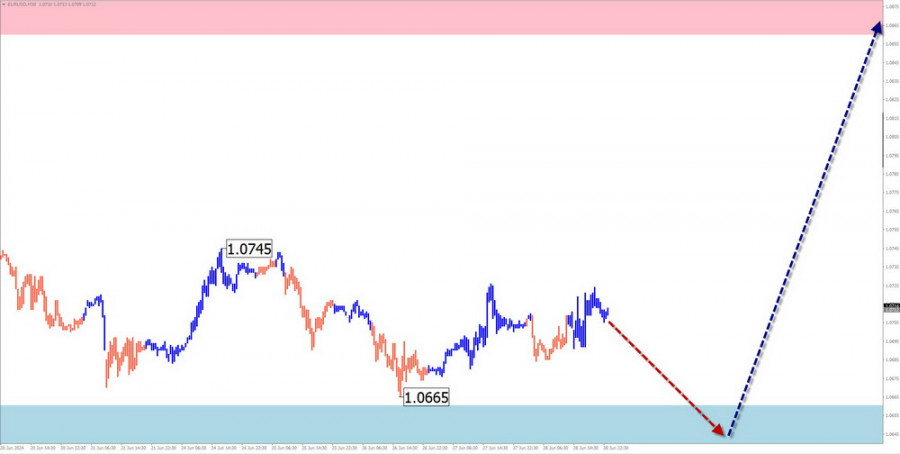
Since July last year, the direction of euro price fluctuations has been set by a downward wave algorithm. Lines drawn through the extremums on the chart show a "horizontal pennant" figure, which has not yet been completed. The upward segment from April 16 has no reversal potential and remains within the current wave model.
Forecast:
The euro currency price is expected to continue its flat, sideways movement in the coming days. There is a high chance of a halt and the formation of reversal conditions in the area of the calculated support. The upward vector movement of the euro is expected to begin by the end of the week.
Resistance:
Support:
Recommendations:
Analysis:
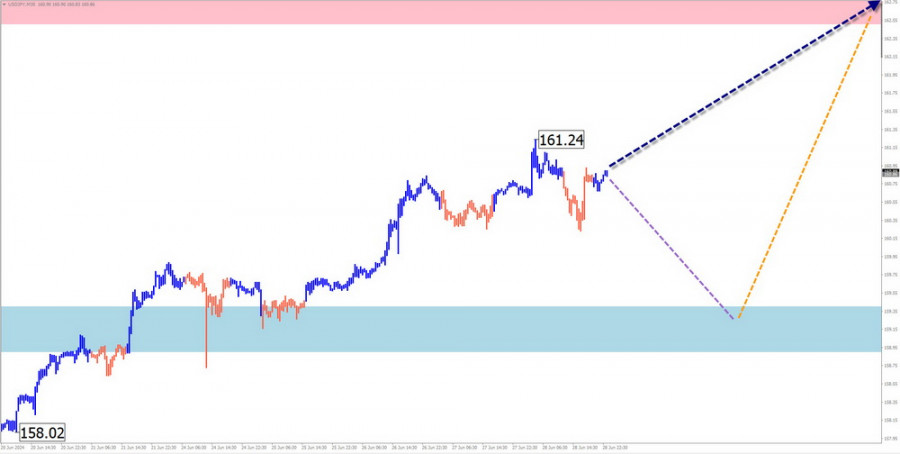
Since December last year, a dominant, currently incomplete upward wave has set the direction of price fluctuations for the Japanese yen major. The final part (C) of the wave has been forming over the past two months. This movement has entered its final phase.
Forecast:
During the upcoming weekly period, the upward price movement of the major is expected to continue, with the prospect of rising to the calculated resistance zone. In the first few days, a sideways flat movement is more likely. A short-term decline, not exceeding the support boundaries, cannot be ruled out.
Resistance:
Support:
Recommendations:
Analysis:
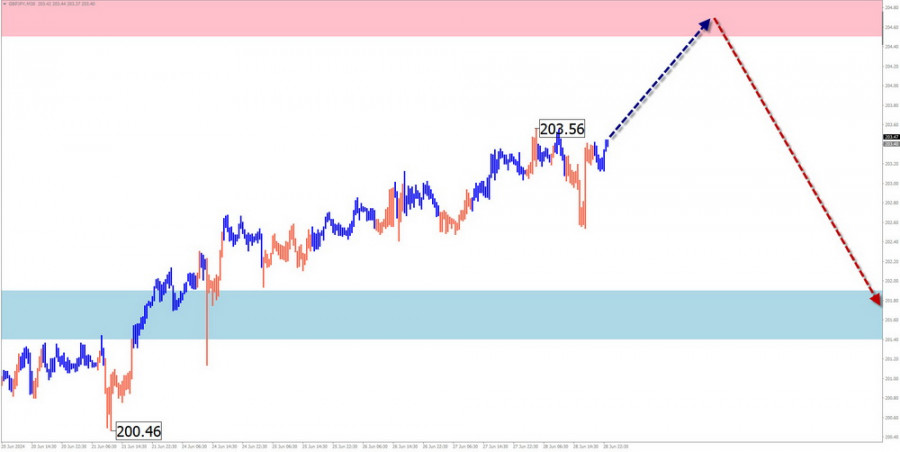
Since early May this year, the short-term price movement of the GBP/JPY pair has been set by an upward wave. The quotes have reached the boundaries of a strong potential reversal zone on the weekly timeframe. Analysis of the structure shows its incompleteness.
Forecast:
In the upcoming weekly period, the upward movement of the cross is expected to continue until it contacts the calculated resistance zone. A reversal is highly likely to follow. The price movement of the pair downwards is limited by the calculated support zone.
Resistance:
Support:
Recommendations:
Analysis:
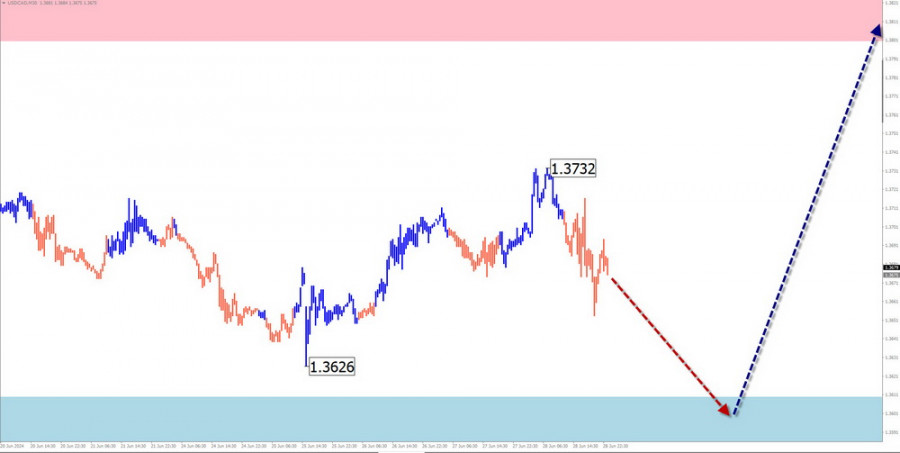
This year, the upward wave formed on the Canadian dollar chart creates an opposing corrective flat. Quotes have been moving in a sideways price corridor for the third month. Analysis of the current wave structure shows its incompleteness. The price is approaching the upper boundary of the potential reversal zone on the daily chart.
Forecast:
In the coming days, continued downward movement is expected until the calculated zone is reached. After that, a bounce upward from the support boundaries is likely. The resistance zone represents the maximum expected upper level of the pair's weekly volatility.
Resistance:
Support:
Recommendations:
Brief Analysis:
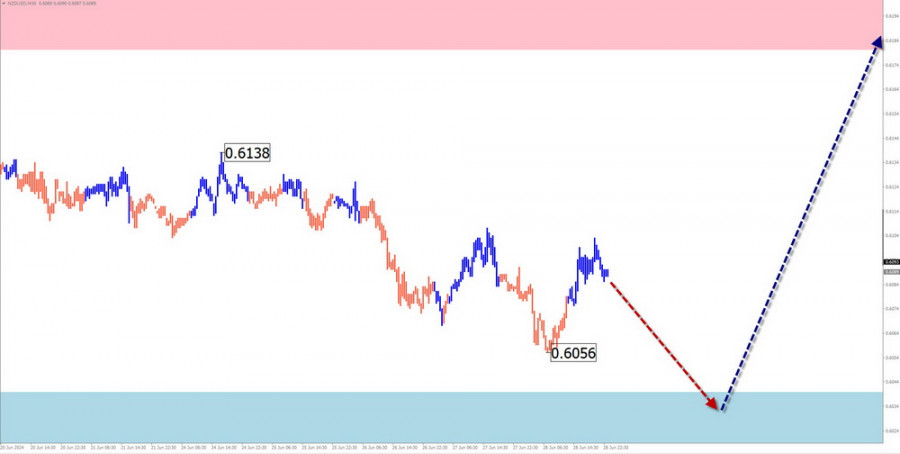
The New Zealand dollar has been moving downward within the dominant bearish wave since last summer. The wave's extremes on the price chart form a "horizontal pennant." At the time of analysis, the bullish segment from April 19 remains within the boundaries of an internal correction. Within this framework, a downward pullback has been forming in recent weeks.
Weekly Forecast:
In the next couple of days, continued downward movement is expected. A change in the movement direction to sideways is anticipated in the calculated support zone, forming conditions for a reversal. An upward price movement is likely in the week's second half.
Resistance:
Support:
Recommendations
Analysis:
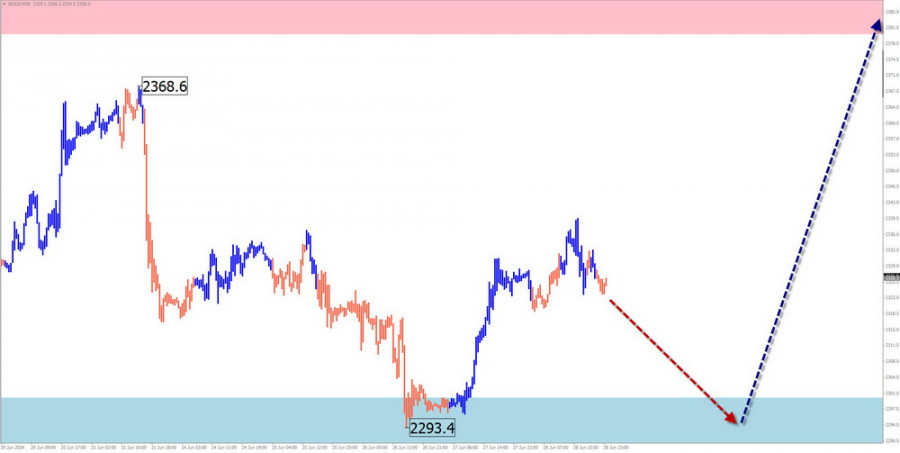
Gold prices have been moving predominantly horizontally since April this year. The downward plane is forming in place of a correction of the previous bullish trend. The price is pressing against the upper boundary of the sideways corridor formed on the chart over the past two months.
Forecast:
Pressure on the support zone may end in the next few days. Afterward, a reversal and resumption of price growth can be expected. The highest activity of price fluctuations is expected closer to the weekend.
Resistance:
Support:
Recommendations:
Explanations: In simplified wave analysis (SWA), all waves consist of 3 parts (A-B-C). The last unfinished wave is analyzed on each timeframe. Dotted lines indicate expected movements.
Attention: The wave algorithm does not account for the duration of instrument movements over time!You have already liked this post today
*บทวิเคราะห์ในตลาดที่มีการโพสต์ตรงนี้ เพียงเพื่อทำให้คุณทราบถึงข้อมูล ไม่ได้เป็นการเจาะจงถึงขั้นตอนให้คุณทำการซื้อขายตาม
รูปแบบคลื่นในกราฟ 4 ชั่วโมงของคู่สกุลเงิน EUR/USD ได้เปลี่ยนแปลงเป็นโครงสร้างที่เป็นขาขึ้นและยังคงรักษารูปแบบนี้เอาไว้ ฉันเชื่อว่ามีความสงสัยเล็กน้อยว่าการเปลี่ยนแปลงนี้เกิดขึ้นเนื่องจากนโยบายการค้าใหม่ของสหรัฐฯ เพียงอย่างเดียว จนถึงวันที่ 28 กุมภาพันธ์ เมื่อตอนที่ค่าเงินดอลลาร์สหรัฐเริ่มร่วงลงอย่างรวดเร็ว ทั้งรูปแบบคลื่นทั้งหมดก็ยังคงดูเหมือนแนวโน้มขาลงที่น่าเชื่อถือ โดยมีคลื่นปรับแก้ 2 กำลังก่อตัวขึ้น
รูปแบบคลื่นสำหรับ GBP/USD ยังคงบ่งบอกถึงการก่อตัวของโครงสร้างคลื่นที่มีแรงผลักดันขึ้น รูปแบบคลื่นมีความเหมือนกับการระบายที่เกิดขึ้นกับคู่เงิน EUR/USD จนถึงวันที่ 28 กุมภาพันธ์ เราสังเกตเห็นการก่อตัวของโครงสร้างการแก้ไขที่มีความชัดเจน และไม่มีข้อสงสัยใดๆ อย่างไรก็ตาม หลังจากนั้น ความต้องการสำหรับสกุลเงินดอลลาร์สหรัฐเริ่มลดลงอย่างรวดเร็ว ส่งผลให้เกิดการกลับตัวของแนวโน้มเป็นขาขึ้น คลื่นลูกที่
รูปแบบคลื่นในกราฟ 4 ชั่วโมงสำหรับ EUR/USD ได้เปลี่ยนแปลงไปเป็นโครงสร้างขาขึ้น และยังคงเป็นเช่นนั้นอยู่ ผมเชื่อว่าไม่มีข้อสงสัยเลยว่าการเปลี่ยนแปลงนี้เกิดขึ้นมาโดยเฉพาะเนื่องจากนโยบายการค้าของสหรัฐฯ ใหม่ จนถึงวันที่ 28 กุมภาพันธ์ เมื่อการลดลงของดอลลาร์สหรัฐฯ เริ่มกลับตัว รูปแบบคลื่นดูเหมือนจะเป็นส่วนหนึ่งของเทรนด์ขาลงที่น่าเชื่อถือ โดยมีคลื่นปรับฐานที่
โครงสร้างคลื่นสำหรับคู่ GBP/USD ยังคงบ่งชี้ถึงการพัฒนาของรูปแบบคลื่นที่ก้าวไปในทิศทางขึ้น การเกิดขึ้นของรูปแบบคลื่นนี้คล้ายคลึงกับคู่ EUR/USD จนกระทั่งถึงวันที่ 28 กุมภาพันธ์ เราสังเกตเห็นการเกิดโครงสร้างการปรับตัวที่น่าเชื่อถือ ซึ่งไม่ทิ้งพื้นที่ให้สงสัย อย่างไรก็ตาม ความต้องการเงินดอลล่าร์สหรัฐเริ่มลดลงอย่างรวดเร็วจนกระทั่งเกิดการพลิกผันไปในทางขึ้น คลื่น 2 ของแนวโน้มนี้มีรูปคลื่นเพียงคลื่นเดียว
โครงสร้างคลื่นบนชาร์ต 4 ชั่วโมงสำหรับ EUR/USD ได้เปลี่ยนเป็นรูปแบบขาขึ้นและยังคงรักษารูปแบบนี้ไว้ ฉันเชื่อว่าไม่มีข้อสงสัยว่า การเปลี่ยนแปลงนี้เกิดขึ้นเพียงเพราะนโยบายการค้าของสหรัฐฯ ใหม่เท่านั้น ก่อนวันที่ 28 กุมภาพันธ์ ซึ่งเป็นช่วงที่ค่าเงินดอลลาร์สหรัฐเริ่มลดลงอย่างมาก โครงสร้างคลื่นปรากฏเป็นสองช่วงแนวโน้มขาลงที่น่าเชื่อถือ กำลังมีการสร้างคลื่นที่แก้ไขที่
โครงสร้างคลื่นของ GBP/USD ยังคงแสดงถึงการก่อตัวของรูปแบบคลื่นแรงกระตุ้นขาขึ้น โครงสร้างของคลื่นมีความใกล้เคียงกับของ EUR/USD จนถึงวันที่ 28 กุมภาพันธ์ เราสังเกตเห็นรูปแบบโครงสร้างที่มีความน่าเชื่อถือ โดยไม่มีข้อสงสัยแต่อย่างใด อย่างไรก็ตาม ความต้องการดอลลาร์สหรัฐจากนั้นเริ่มลดลงอย่างรวดเร็ว ส่งผลให้เกิดการกลับตัวของแนวโน้ม คลื่นที่
การวิเคราะห์: ตั้งแต่เดือนเมษายน การเคลื่อนไหวที่สูงขึ้นเป็นหลักของเงินปอนด์อังกฤษกำลังพัฒนาส่วนสุดท้าย (C) ของมัน คลื่นกำลังก่อตัวเป็นแบบ impulsive และยังไม่มีสัญญาณการสิ้นสุด ราคาย้อนกลับจากขอบล่างของโซนกลับตัวที่กว้างซึ่งก่อตัวเป็นการปรับฐาน คาดการณ์: ในสัปดาห์ที่จะถึงนี้ ราคาคาดว่าจะเคลื่อนไปยังโซนความต้านทานที่คำนวณไว้ อาจมีการเคลื่อนไหวลงพร้อมกับแรงกดดันไปยังโซนสนับสนุนในช่วงต้นสัปดาห์ ความผันผวนที่สูงขึ้นคาดว่าจะเกิดขึ้นในช่วงหลังของสัปดาห์ โซนกลับตัวที่เป็นไปได้
การวิเคราะห์: ตั้งแต่เดือนกุมภาพันธ์ปีนี้ การเคลื่อนไหวของราคาเงินยูโรถูกกำหนดโดยคลื่นที่มีแนวโน้มขาขึ้น ส่วนที่ลดลงตั้งแต่วันที่ 11 เมษายน ปัจจุบันยังขาดศักยภาพสำหรับการกลับตัวและยังคงอยู่ในช่วงการแก้ไขของแนวโน้ม เส้นที่วาดผ่านจุดสุดขีดแสดงให้เห็นรูปแบบ "ผลธงแนวนอน" ซึ่งยังไม่เสร็จสิ้น การคาดการณ์: ในอีกไม่กี่วันข้างหน้า คาดว่าจะมีการเคลื่อนไหวในแนวราบของเงินยูโรต่อไป อาจมีการลดลงในระยะสั้นไปยังโซนแนวรับ หลังจากนั้น
โครงสร้างคลื่นสำหรับ GBP/USD ยังคงบ่งชี้ถึงการพัฒนาของรูปแบบคลื่นกระจุยขึ้น โครงสร้างคลื่นแทบจะเหมือนกับ EUR/USD จนถึงวันที่ 28 กุมภาพันธ์ เราสังเกตเห็นการก่อตัวของโครงสร้างการแก้ไขที่น่าเชื่อถือ ซึ่งไม่มีข้อสงสัยมากนัก อย่างไรก็ตาม ความต้องการในเงินดอลลาร์สหรัฐฯ เริ่มลดลงอย่างรุนแรง ทำให้เกิดการกลับแนวโน้ม คลื่น
รูปแบบคลื่นในกราฟ 4 ชั่วโมงสำหรับ EUR/USD ได้เปลี่ยนเป็นโครงสร้างขาขึ้นและยังคงเป็นเช่นนั้น ชัดเจนว่าการเปลี่ยนแปลงนี้เกิดขึ้นเพียงเพราะนโยบายการค้าใหม่ของสหรัฐฯ ก่อนวันที่ 28 กุมภาพันธ์ เมื่อดอลลาร์สหรัฐเริ่มลดลงอย่างรวดเร็ว รูปแบบคลื่นเป็นแนวโน้มขาลงที่น่าเชื่อถือที่กำลังสร้างคลื่นการปรับปรุงตัวที่ 2 อย่างไรก็ตาม การประกาศรายสัปดาห์ของ Donald
 InstaFutures
Make money with a new promising instrument!
สมาชิกInstaForex

Your IP address shows that you are currently located in the USA. If you are a resident of the United States, you are prohibited from using the services of InstaFintech Group including online trading, online transfers, deposit/withdrawal of funds, etc.
If you think you are seeing this message by mistake and your location is not the US, kindly proceed to the website. Otherwise, you must leave the website in order to comply with government restrictions.
Why does your IP address show your location as the USA?
Please confirm whether you are a US resident or not by clicking the relevant button below. If you choose the wrong option, being a US resident, you will not be able to open an account with InstaTrade anyway.
We are sorry for any inconvenience caused by this message.

