อ่านรายละเอียดเพิ่มเติม


 14.09.2022 07:29 PM
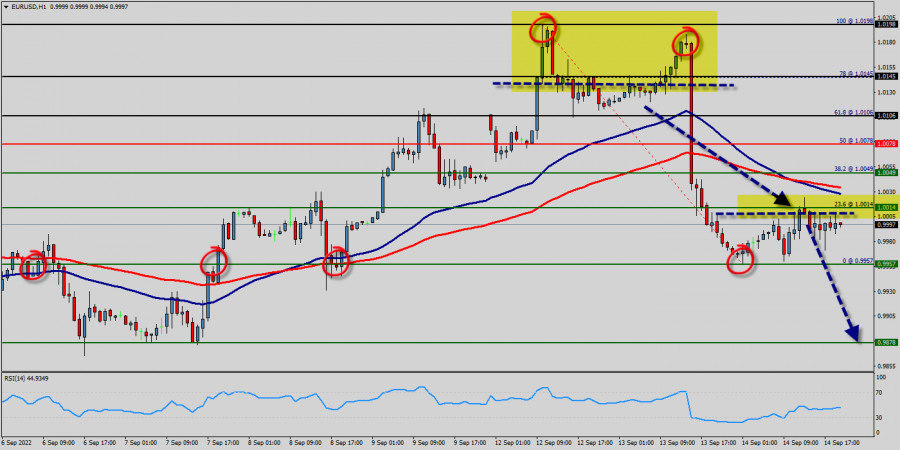
The EUR/USD pair stayed below the psychological level of 1.0078 over the week, indicating a lack of urgency to accumulate at the current levels. The bears are attempting to extend EUR/USD pair's decline below 0.9957 to bottomed at 1 USD right now.
The EUR/USD pair remains downside for consolidation below 1.0078 temporary low. Downside of recovery should be limited by 0.9957 support turned resistance to bring another fall.
The Euro pair depreciated further to 1 USD, the lowest level in this week, falling towards parity against the dollar on concerns the energy crisis would lead Europe's region to a deep recession, placing the ECB between a rock and a hard place as it tries to curb inflation and rest a slowing economy. The EUR/USD pair decreased within adown channel.
It then trimmed losses, dropping to 0.9957. The move lower took place amid a stronger US dollar across the board. Probably, the main scenario is continued decline towards 0.9800 (sentiment level). Some fundamental news will impact on the EUR/USD pair in coming days because The euro has a flexible exchange rate, which is dependent on three factors : The European Central Bank's benchmark interest rate. Additionally, the debt levels of individual countries within the EU. Moreover, the strength of the European economy.
Closing below the pivot point (1.0078) could assure that the EUR/USD pair will move lower towards cooling new lows. Then, the bears must break through the price of 1 USD n order to resume the downtrend.
The trend is still below the 100 EMA for that the bearish outlook remains the same as long as the 100 EMA is headed to the downside. Hence, the price spot of 1.0078 remains a significant resistance zone.
Also it should notice that the Euro is edging lower against the U.S. Dollar late in the session this morning in a volatile session that saw the single currency posting an early loss before continuing after data in the U.S. showed the world's largest economy created more jobs than expected this month.
Since the trend is below the 50% Fibonacci level (1.0078), the market is still in a downtrend. Overall, we still prefer the bearish scenario. Consequently, there is a possibility that the EUR/USD pair will move downside. The structure of a fall does not look corrective.
If the pair fails to pass through the level of 0.9957, the market will indicate a bearish opportunity below the strong resistance level of 1.0078.
The trend is still calling for a strong bearish market from the spot of 1.0078. Sellers are asking for a high price. In this regard, sell deals are recommended lower than the 1.0078 level with the first target at 0.9957.
It is possible that the pair will carry on downwards continuing the development of the bearish trend to the level 0.9878.
However, stop loss has always been in consideration thus it will be useful to set it above the last double top at the level of 1.0198 (notice that the major resistance today has set at 1.0198). Please check out the market volatility before investing, because the sight price may have already been reached and scenarios might have become invalidated.
You have already liked this post today
*บทวิเคราะห์ในตลาดที่มีการโพสต์ตรงนี้ เพียงเพื่อทำให้คุณทราบถึงข้อมูล ไม่ได้เป็นการเจาะจงถึงขั้นตอนให้คุณทำการซื้อขายตาม
ในวันพุธ คู่เงิน EUR/USD ยังคงปรับตัวขึ้นและยืนเหนือระดับ 50.0% ของ Fibonacci retracement ที่ 1.1320 เป็นผลให้ค่าเงินยูโรอาจยังคงปรับตัวขึ้นต่อไปสู่แนวต้านถัดไปที่โซน 1.1374–1.1380 การยืนต่ำกว่า 1.1320 จะเป็นการหนุนค่าเงินดอลลาร์สหรัฐและทำให้เกิดการปรับตัวลงสู่โซนแนวรับที่
ในกราฟรายชั่วโมง คู่เงิน GBP/USD ยังคงปรับตัวสูงขึ้นในวันพุธ โดยปิดสิ้นวันที่ระดับใกล้เคียงกับ 1.3425 เพียงแค่สองสามสัปดาห์ที่ผ่านมา ยังไม่มีสัญญาณของการขายดอลลาร์ออกมาอีก แต่ความหวังของนักเทรดเกี่ยวกับข้อตกลงระหว่างสหรัฐฯ–จีนได้หายไปอย่างรวดเร็ว การเคลื่อนไหวขาขึ้นของเงินปอนด์อาจดำเนินต่อไปสู่ระดับ Fibonacci retracement ถัดไปที่ 161.8% –
ลิงก์ที่มีประโยชน์: คุณสามารถอ่านบทความอื่นของฉันได้ในส่วนนี้ คอร์สสำหรับผู้เริ่มต้นของ InstaForex ระบบวิเคราะห์ที่เป็นที่นิยม เปิดบัญชีซื้อขาย สำคัญ: ผู้เริ่มต้นในตลาดฟอเร็กซ์ควรระมัดระวังอย่างมากเมื่อทำการตัดสินใจเกี่ยวกับการเข้าสู่ตลาด ก่อนการเปิดเผยรายงานสำคัญ ๆ ควรหลีกเลี่ยงการอยู่ในตลาดเพื่อลดความเสี่ยงจากการถูกอิทธิพลของความผันผวน หากคุณตัดสินใจเทรดในช่วงที่มีการเผยแพร่ข่าวสาร ควรตั้งค่า stop orders
ราคาของ Bitcoin พุ่งสูงขึ้นไปแตะจุดสูงสุดใหม่ที่ระดับ $111,000 แต่กลับไม่สามารถยืนอยู่เหนือระดับดังกล่าวได้ เหรียญนี้รวมถึงตลาดคริปโตโดยรวมยังคงได้รับการสนับสนุนจากการอ่อนตัวของดอลลาร์ในช่วงที่ผลตอบแทนจากพันธบัตรคลังสหรัฐฯ เพิ่มขึ้นและการเปลี่ยนแปลงทางการเงินของระบบภาษีสหรัฐฯ ที่อาจนำไปสู่การเพิ่มขึ้นของความต้องการเหรียญนี้ในระยะยาว ในมุมมองทางเทคนิค ปัจจุบัน Bitcoin อยู่ในสภาวะที่มีการซื้อมากเกินไปและอาจเกิดการปรับฐานลง เนื่องจากยังไม่สามารถยืนเหนือระดับ $111,000 ได้
ด้วยการเกิดดิเวอร์เจนซ์ระหว่างการเคลื่อนไหวของดัชนี Nasdaq 100 ซึ่งสร้างรูปแบบ Double Top กับตัวชี้วัด Stochastic Oscillator พร้อมการยืนยันจากการเคลื่อนไหวของราคา ซึ่งเคลื่อนที่ต่ำกว่า WMA (21) ที่มีการลาดลงในกราฟ
ขณะที่เรากำลังดูกราฟ 4 ชั่วโมงของคู่เงินหลัก USD/CHF จะเห็นข้อมูลที่น่าสนใจบางอย่างปรากฏขึ้น คือประการแรกการเกิด Divergence ระหว่างการเคลื่อนไหวของราคา USD/CHF กับตัวบ่งชี้ Stochastic Oscillator ประการที่สองการปรากฏขึ้นของรูปแบบ Bearish
เมื่อวันพุธที่ผ่านมา ยูโรสามารถปรับตัวเหนือระดับ 1.1266 และเหนือเส้นดัชนีสมดุลได้สำเร็จ ระดับเป้าหมายถัดไปคือ 1.1420 และ 1.1535 ออสซิลเลเตอร์ Marlin กำลังจะเข้าสู่พื้นที่ของแรงขับเคลื่อนแนวโน้มขาขึ้น วันนี้ มีการคาดการณ์ว่ารายงานทางเศรษฐกิจที่แข็งแกร่งจะออกมาจากกลุ่มประเทศยูโรโซน ดัชนีความคาดหวังทางธุรกิจ
คู่เงิน USD/JPY ได้ปรับตัวลดลงต่อเนื่องเป็นเวลาแปดวัน — ซึ่งเป็นรูปแบบที่ไม่เคยเห็นตั้งแต่ปี 2019 อย่างไรก็ดี เราเพิ่งเห็นการลดลงต่อเนื่องห้าสัปดาห์ในเดือนกรกฎาคม 2024 และพฤศจิกายน-ธันวาคม 2023 ซึ่งบ่งบอกว่าเงินเยนอาจกำลังเตรียมตัวสำหรับสิ่งที่มีนัยสำคัญ นอกจากนี้ยังมีปัจจัยเสริมจากกราฟรายวันที่ราคาได้รวมตัวอยู่ต่ำกว่าบรรทัดตัวบ่งชี้สำคัญ และออสซิลเลเตอร์ Marlin
ราคาของเงินกำลังพุ่งขึ้นไปใกล้ระดับ $33.25 โดยมีการปรับฐานใกล้ขอบเขตด้านบนของช่วงที่คุ้นเคย การที่มีการซื้อเมื่อราคาย่อตัว การฟื้นตัวล่าสุดจากค่าเฉลี่ยเคลื่อนที่แบบธรรมดา (SMA) และค่าเฉลี่ยเคลื่อนที่แบบเอ็กซ์โพเนนเชียล (EMA) ที่ 100 วัน รวมทั้งตอนนี้ออสซิลเลเตอร์ในกราฟรายวันเริ่มหันไปที่ทิศทางบวก ล้วนสนับสนุนแนวโน้มเชิงบวกในระยะสั้นสำหรับคู่สกุลเงิน XAG/USD การเคลื่อนที่ขึ้นอย่างต่อเนื่องเหนือระดับ
Your IP address shows that you are currently located in the USA. If you are a resident of the United States, you are prohibited from using the services of InstaFintech Group including online trading, online transfers, deposit/withdrawal of funds, etc.
If you think you are seeing this message by mistake and your location is not the US, kindly proceed to the website. Otherwise, you must leave the website in order to comply with government restrictions.
Why does your IP address show your location as the USA?
Please confirm whether you are a US resident or not by clicking the relevant button below. If you choose the wrong option, being a US resident, you will not be able to open an account with InstaTrade anyway.
We are sorry for any inconvenience caused by this message.

