Vea también


El patrón Banderín es bien conocido y ampliamente utilizado en el análisis técnico. Esta cifra se encuentra regularmente en los gráficos comerciales o casi todos los pares de divisas.
El desarrollo del patrón Banderín en el gráfico comercial indica la continuación de la tendencia.
El patrón Banderín es bien conocido y ampliamente utilizado en el análisis técnico. Esta cifra se encuentra regularmente en los gráficos comerciales o casi todos los pares de divisas.
El patrón Banderín puede ser tanto alcista como bajista. Para un patrón banderín, el asta se dirige al alza con un banderín en el punto más alto. Un banderín bajista tiene un asta dirigida a la baja con la formación de un ángulo en el punto más bajo de la tendencia.
El momento adecuado para ingresar en el mercado es el momento en que el precio atraviesa la línea Banderín que forma un triángulo en dirección de su principal tendencia relativa al asta.
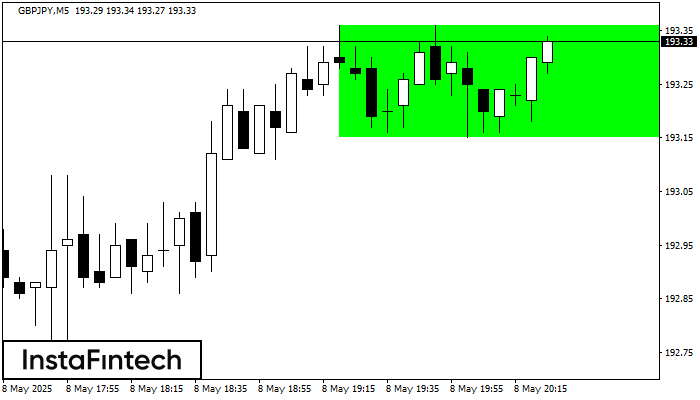
Сформирована фигура «Прямоугольник» на графике GBPJPY M5. Тип фигуры: Продолжение тренда; Границы: Верхняя 193.36, Нижняя 193.15; Сигнал: позицию на покупку следует открывать выше верхней границы прямоугольника 193.36
Таймфреймы М5 и М15 могут иметь больше ложных точек входа.
Открыть график инструмента в новом окне
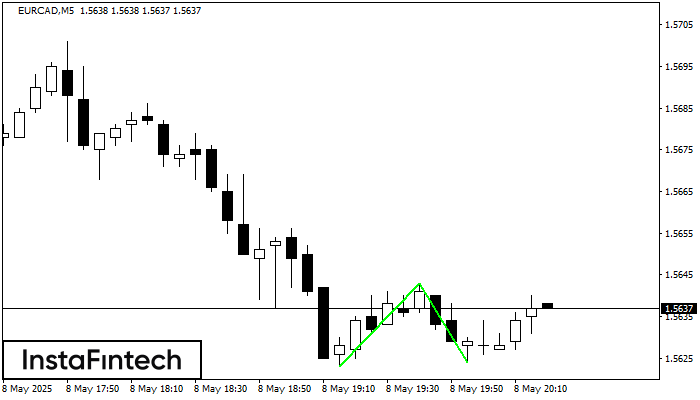
Сформирована фигура «Двойное дно» на графике EURCAD M5. Верхняя граница 1.5643; Нижняя граница 1.5624; Ширина фигуры 20 пунктов. В случае пробоя верхней границы 1.5643 можно будет прогнозировать изменение тенденции
Таймфреймы М5 и М15 могут иметь больше ложных точек входа.
Открыть график инструмента в новом окне
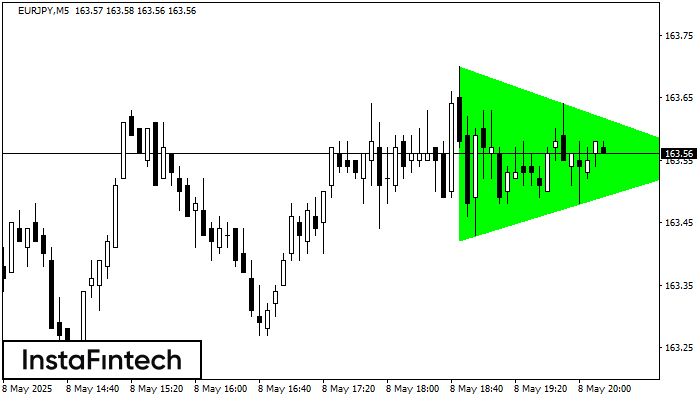
По EURJPY на M5 сформировалась фигура «Бычий симметричный треугольник». Нижняя граница фигуры имеет координаты 163.42/163.55, при этом верхняя граница 163.70/163.55. Формирование фигуры «Бычий симметричный треугольник» наиболее вероятным образом свидетельствует
Таймфреймы М5 и М15 могут иметь больше ложных точек входа.
Открыть график инструмента в новом окне


Your IP address shows that you are currently located in the USA. If you are a resident of the United States, you are prohibited from using the services of InstaFintech Group including online trading, online transfers, deposit/withdrawal of funds, etc.
If you think you are seeing this message by mistake and your location is not the US, kindly proceed to the website. Otherwise, you must leave the website in order to comply with government restrictions.
Why does your IP address show your location as the USA?
Please confirm whether you are a US resident or not by clicking the relevant button below. If you choose the wrong option, being a US resident, you will not be able to open an account with InstaTrade anyway.
We are sorry for any inconvenience caused by this message.