

Patrones actuales

Los patrones son modelos gráficos que se forman en el gráfico mediante el precio. Según uno de los postulados del análisis técnico, la historia (movimiento del precio) se repite. Esto quiere decir que los movimientos del precio a menudo son similares en las mismas situaciones que hacen posible pronosticar el futuro desarrollo de la situación con una alta probabilidad.
Los patrones relevantes de InstaTrade son un servicio fácil de utilizar que permiten que conozca los últimos cambios en el mercado y reaccione a las pistas del mercado a tiempo. En nuestro servicio, siempre encontrará los últimos y más importantes patrones en cualquier par y en cualquier marco de tiempo.
Triple Top
was formed on 18.04 at 17:45:14 (UTC+0)
signal strength 2 of 5
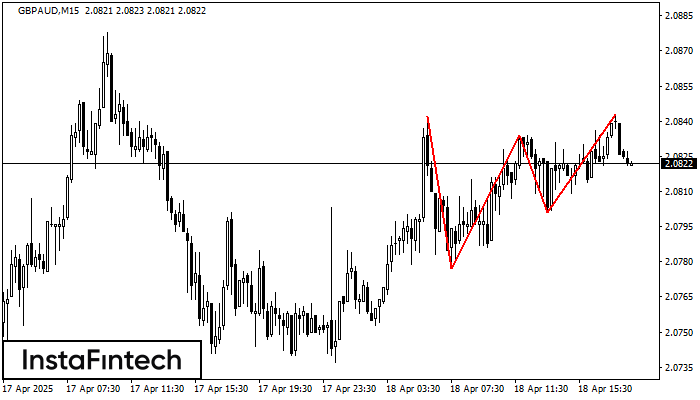
The Triple Top pattern has formed on the chart of the GBPAUD M15 trading instrument. It is a reversal pattern featuring the following characteristics: resistance level -1, support level -24, and pattern’s width 65. Forecast If the price breaks through the support level 2.0777, it is likely to move further down to 2.0812.
The M5 and M15 time frames may have more false entry points.
- All
- All
- Bearish Rectangle
- Bearish Symmetrical Triangle
- Bearish Symmetrical Triangle
- Bullish Rectangle
- Double Top
- Double Top
- Triple Bottom
- Triple Bottom
- Triple Top
- Triple Top
- All
- All
- Buy
- Sale
- All
- 1
- 2
- 3
- 4
- 5
Triángulo Simétrico Alcista
was formed on 30.04 at 20:01:25 (UTC+0)
signal strength 2 of 5
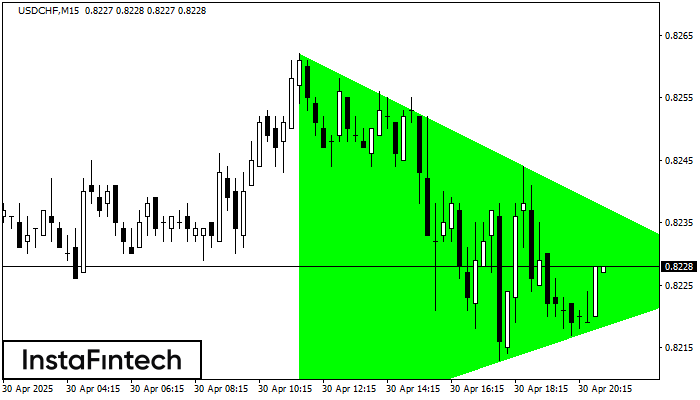
Según el gráfico de M15, USDCHF formó el patrón Triángulo Simétrico Alcista. Descripción: Este es el patrón de la continuación de una tendencia. 0.8262 y 0.8202 son las coordenadas
Los marcos de tiempo M5 y M15 pueden tener más puntos de entrada falsos.
Open chart in a new window
Doble Piso
was formed on 30.04 at 20:00:54 (UTC+0)
signal strength 2 of 5
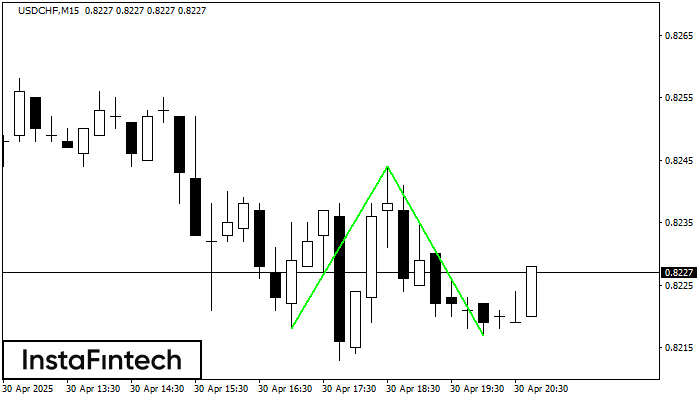
El patrón Doble Piso ha sido formado en USDCHF M15; el límite superior es 0.8244; el límite inferior es 0.8217. El ancho del patrón es 26 puntos. En caso
Los marcos de tiempo M5 y M15 pueden tener más puntos de entrada falsos.
Open chart in a new window
Bandera alcista
was formed on 30.04 at 19:53:06 (UTC+0)
signal strength 1 of 5
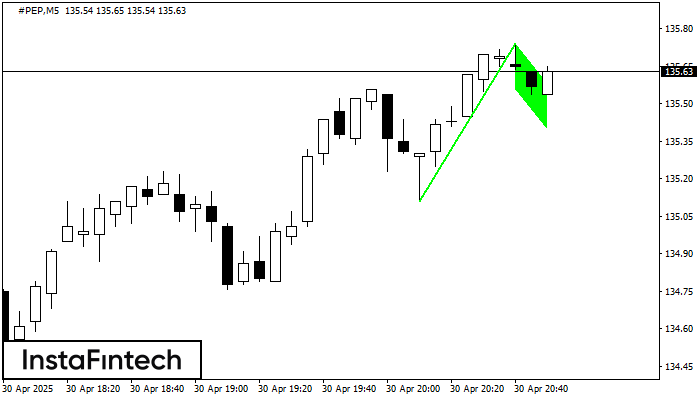
El patrón Bandera alcista ha sido formado en #PEP a M5. El límite inferior del patrón está ubicado en 135.56/135.40, mientras que el límite superior se encuentra en 135.74/135.58
Los marcos de tiempo M5 y M15 pueden tener más puntos de entrada falsos.
Open chart in a new window


