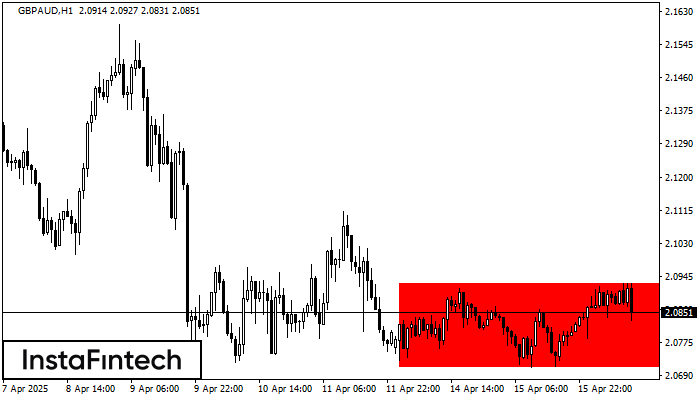
Bearish Rectangle
was formed on 16.04 at 10:28:36 (UTC+0)
signal strength 4 of 5

According to the chart of H1, GBPAUD formed the Bearish Rectangle. The pattern indicates a trend continuation. The upper border is 2.0927, the lower border is 2.0711. The signal means that a short position should be opened after fixing a price below the lower border 2.0711 of the Bearish Rectangle.
Vea asimismo
- All
- All
- Bearish Rectangle
- Bearish Symmetrical Triangle
- Bearish Symmetrical Triangle
- Bullish Rectangle
- Double Top
- Double Top
- Triple Bottom
- Triple Bottom
- Triple Top
- Triple Top
- All
- All
- Buy
- Sale
- All
- 1
- 2
- 3
- 4
- 5
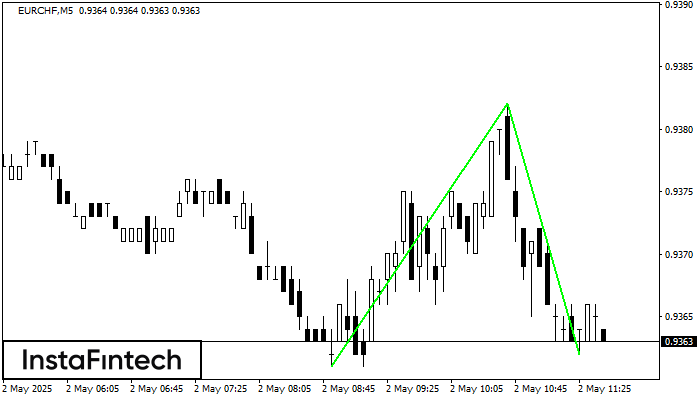
Doble Piso
was formed on 02.05 at 10:41:00 (UTC+0)
signal strength 1 of 5
El patrón Doble Piso ha sido formado en EURCHF M5. Características: el nivel de soporte 0.9361; el nivel de resistencia 0.9382; el ancho del patrón 21 puntos. Si el nivel
Los marcos de tiempo M5 y M15 pueden tener más puntos de entrada falsos.
Open chart in a new window
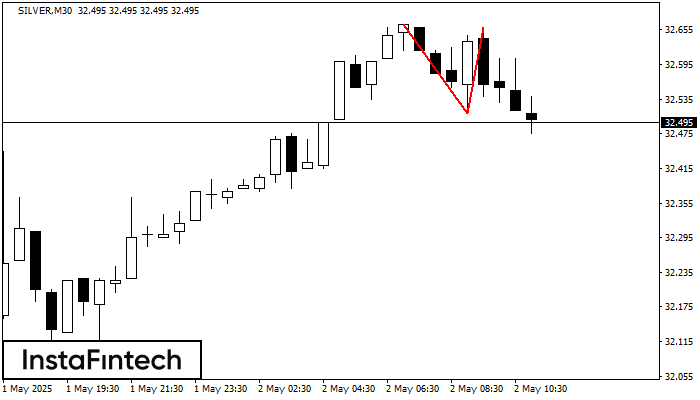
Doble Techo
was formed on 02.05 at 10:31:38 (UTC+0)
signal strength 3 of 5
En el gráfico de SILVER M30 el patrón de reversión Doble Techo ha sido formado. Características: límite superior 32.66; límite inferior 32.51; el ancho del patrón 150 puntos. La señal
Open chart in a new window
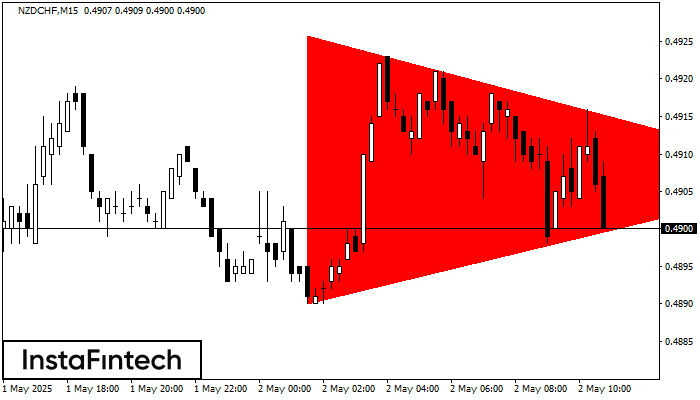
Triángulo Simétrico Bajista
was formed on 02.05 at 09:51:53 (UTC+0)
signal strength 2 of 5
Según el gráfico de M15, el NZDCHF formó el patrón Triángulo Simétrico Bajista. Descripción: El límite inferior es 0.4890/0.4907 y el límite superior es 0.4926/0.4907. El ancho del patrón
Los marcos de tiempo M5 y M15 pueden tener más puntos de entrada falsos.
Open chart in a new window


