

Patrones actuales

Los patrones son modelos gráficos que se forman en el gráfico mediante el precio. Según uno de los postulados del análisis técnico, la historia (movimiento del precio) se repite. Esto quiere decir que los movimientos del precio a menudo son similares en las mismas situaciones que hacen posible pronosticar el futuro desarrollo de la situación con una alta probabilidad.
Los patrones relevantes de InstaTrade son un servicio fácil de utilizar que permiten que conozca los últimos cambios en el mercado y reaccione a las pistas del mercado a tiempo. En nuestro servicio, siempre encontrará los últimos y más importantes patrones en cualquier par y en cualquier marco de tiempo.
Bullish Symmetrical Triangle
was formed on 08.04 at 06:53:55 (UTC+0)
signal strength 1 of 5
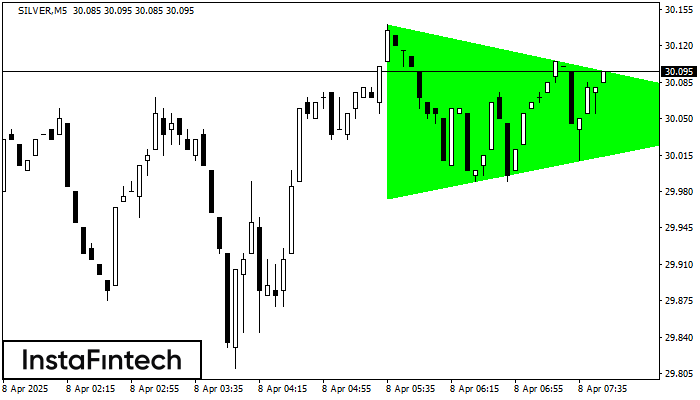
According to the chart of M5, SILVER formed the Bullish Symmetrical Triangle pattern. The lower border of the pattern touches the coordinates 29.97/30.05 whereas the upper border goes across 30.14/30.05. If the Bullish Symmetrical Triangle pattern is in progress, this evidently signals a further upward trend. In other words, in case the scenario comes true, the price of SILVER will breach the upper border to head for 30.07.
The M5 and M15 time frames may have more false entry points.
Vea asimismo
- All
- All
- Bearish Rectangle
- Bearish Symmetrical Triangle
- Bearish Symmetrical Triangle
- Bullish Rectangle
- Double Top
- Double Top
- Triple Bottom
- Triple Bottom
- Triple Top
- Triple Top
- All
- All
- Buy
- Sale
- All
- 1
- 2
- 3
- 4
- 5
Double Top
was formed on 02.05 at 12:15:24 (UTC+0)
signal strength 1 of 5
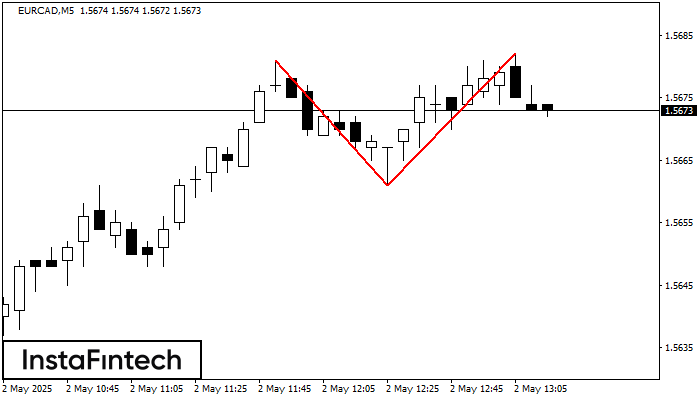
The Double Top pattern has been formed on EURCAD M5. It signals that the trend has been changed from upwards to downwards. Probably, if the base of the pattern 1.5661
The M5 and M15 time frames may have more false entry points.
Open chart in a new window
Inverse Head and Shoulder
was formed on 02.05 at 12:00:11 (UTC+0)
signal strength 4 of 5
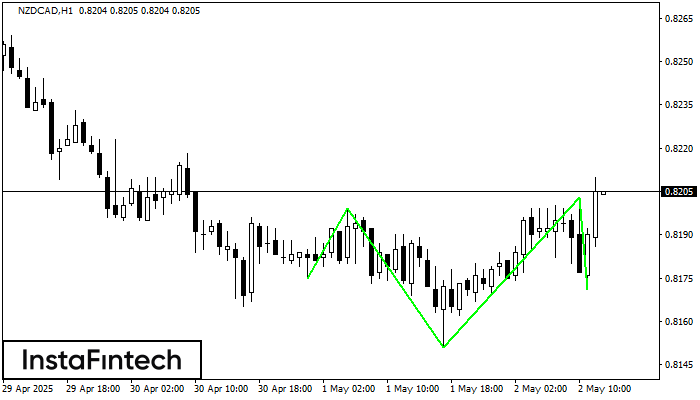
According to the chart of H1, NZDCAD produced the pattern termed the Inverse Head and Shoulder. The Head is fixed at 0.8151 while the median line of the Neck
Open chart in a new window
Triple Top
was formed on 02.05 at 11:00:30 (UTC+0)
signal strength 4 of 5
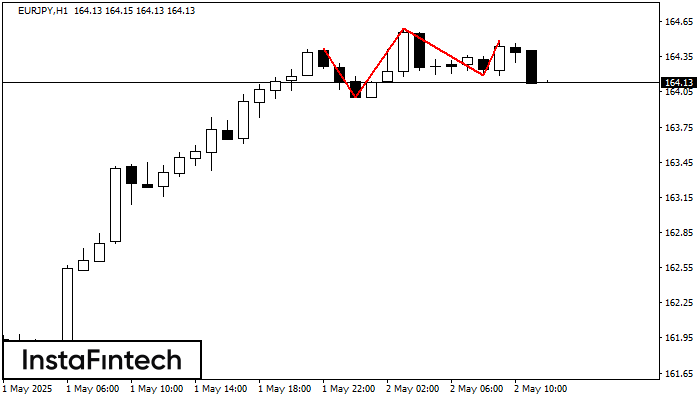
The Triple Top pattern has formed on the chart of the EURJPY H1 trading instrument. It is a reversal pattern featuring the following characteristics: resistance level -7, support level -19
Open chart in a new window


