

Patrones actuales

Los patrones son modelos gráficos que se forman en el gráfico mediante el precio. Según uno de los postulados del análisis técnico, la historia (movimiento del precio) se repite. Esto quiere decir que los movimientos del precio a menudo son similares en las mismas situaciones que hacen posible pronosticar el futuro desarrollo de la situación con una alta probabilidad.
Los patrones relevantes de InstaTrade son un servicio fácil de utilizar que permiten que conozca los últimos cambios en el mercado y reaccione a las pistas del mercado a tiempo. En nuestro servicio, siempre encontrará los últimos y más importantes patrones en cualquier par y en cualquier marco de tiempo.
Triple Bottom
was formed on 06.04 at 13:55:33 (UTC+0)
signal strength 1 of 5

The Triple Bottom pattern has been formed on #Bitcoin M5. It has the following characteristics: resistance level 83143.83/82884.57; support level 82680.13/82625.22; the width is 46370 points. In the event of a breakdown of the resistance level of 83143.83, the price is likely to continue an upward movement at least to 82669.54.
The M5 and M15 time frames may have more false entry points.
Vea asimismo
- All
- All
- Bearish Rectangle
- Bearish Symmetrical Triangle
- Bearish Symmetrical Triangle
- Bullish Rectangle
- Double Top
- Double Top
- Triple Bottom
- Triple Bottom
- Triple Top
- Triple Top
- All
- All
- Buy
- Sale
- All
- 1
- 2
- 3
- 4
- 5
बुलिश आयत
was formed on 02.05 at 02:17:39 (UTC+0)
signal strength 3 of 5
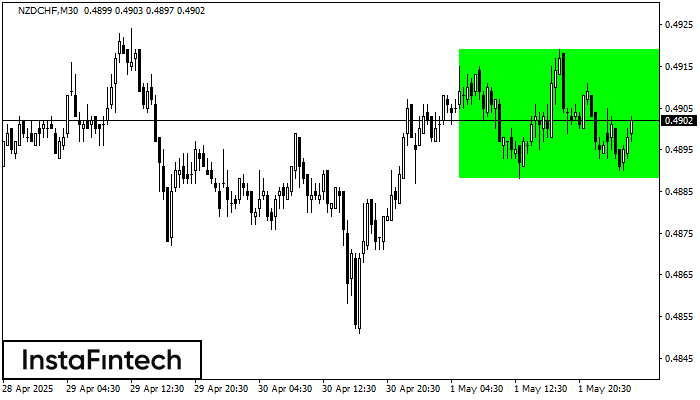
M30 के चार्ट के अनुसार, NZDCHF से बुलिश आयत बना जो एक प्रवृत्ति निरंतरता का पैटर्न है। पैटर्न निम्न सीमाओं के भीतर समाहित है: निचली सीमा 0.4888 – 0.4888
Open chart in a new window
डबल टॉप
was formed on 02.05 at 02:05:35 (UTC+0)
signal strength 1 of 5
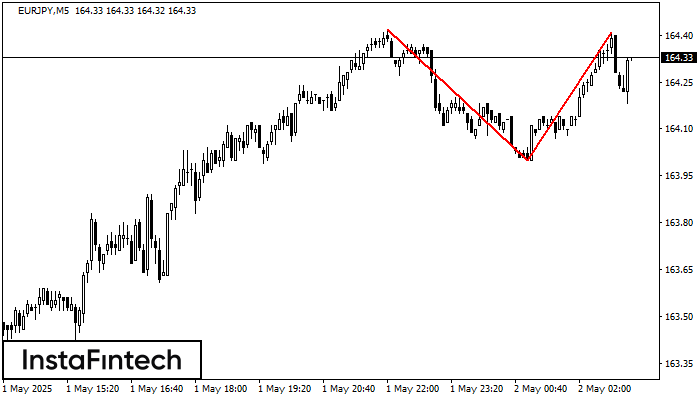
डबल टॉप पैटर्न EURJPY M5 पर बना है। यह संकेत देता है कि प्रवृत्ति ऊपर से नीचे की ओर बदल गई है। संभवतः, यदि 164.00 पैटर्न का आधार टूट जाता
M5 और M15 समय सीमा में अधिक फाल्स एंट्री पॉइंट्स हो सकते हैं।
Open chart in a new window
इन्वर्स हेड एण्ड शोल्डर्स
was formed on 02.05 at 02:00:07 (UTC+0)
signal strength 3 of 5
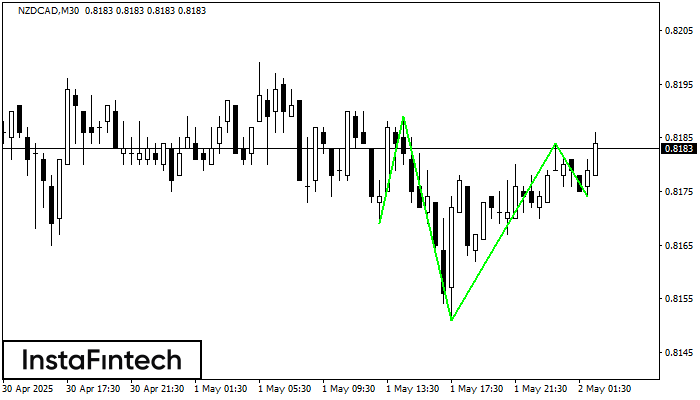
M30 के चार्ट के अनुसार, NZDCAD से इन्वर्स हेड एण्ड शोल्डर्स पैटर्न बना। हेड का टॉप 0.8184 पर सेट है जबकि नेक की मध्य रेखा 0.8151/0.8174 पर स्थित है। इन्वर्स
Open chart in a new window


