

Patrones actuales

Los patrones son modelos gráficos que se forman en el gráfico mediante el precio. Según uno de los postulados del análisis técnico, la historia (movimiento del precio) se repite. Esto quiere decir que los movimientos del precio a menudo son similares en las mismas situaciones que hacen posible pronosticar el futuro desarrollo de la situación con una alta probabilidad.
Los patrones relevantes de InstaTrade son un servicio fácil de utilizar que permiten que conozca los últimos cambios en el mercado y reaccione a las pistas del mercado a tiempo. En nuestro servicio, siempre encontrará los últimos y más importantes patrones en cualquier par y en cualquier marco de tiempo.
Bullish Symmetrical Triangle
was formed on 21.03 at 22:40:31 (UTC+0)
signal strength 1 of 5

According to the chart of M5, AUDUSD formed the Bullish Symmetrical Triangle pattern. Description: This is the pattern of a trend continuation. 0.6279 and 0.6267 are the coordinates of the upper and lower borders respectively. The pattern width is measured on the chart at 12 pips. Outlook: If the upper border 0.6279 is broken, the price is likely to continue its move by 0.6288.
The M5 and M15 time frames may have more false entry points.
Vea asimismo
- All
- All
- Bearish Rectangle
- Bearish Symmetrical Triangle
- Bearish Symmetrical Triangle
- Bullish Rectangle
- Double Top
- Double Top
- Triple Bottom
- Triple Bottom
- Triple Top
- Triple Top
- All
- All
- Buy
- Sale
- All
- 1
- 2
- 3
- 4
- 5
Double Top
was formed on 27.03 at 05:23:08 (UTC+0)
signal strength 1 of 5
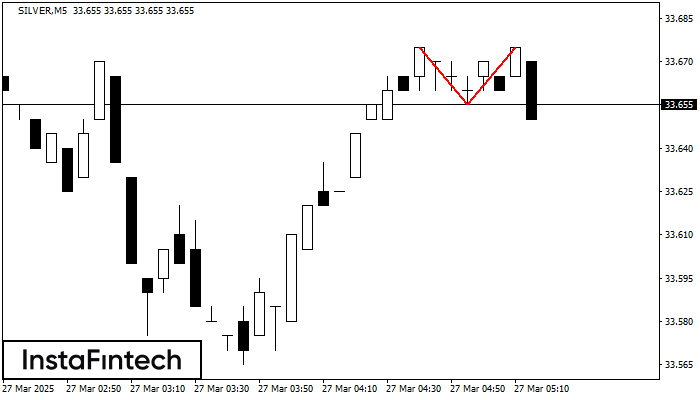
The Double Top reversal pattern has been formed on SILVER M5. Characteristics: the upper boundary 33.67; the lower boundary 33.66; the width of the pattern is 20 points. Sell trades
The M5 and M15 time frames may have more false entry points.
Open chart in a new window
Double Top
was formed on 27.03 at 04:55:37 (UTC+0)
signal strength 1 of 5
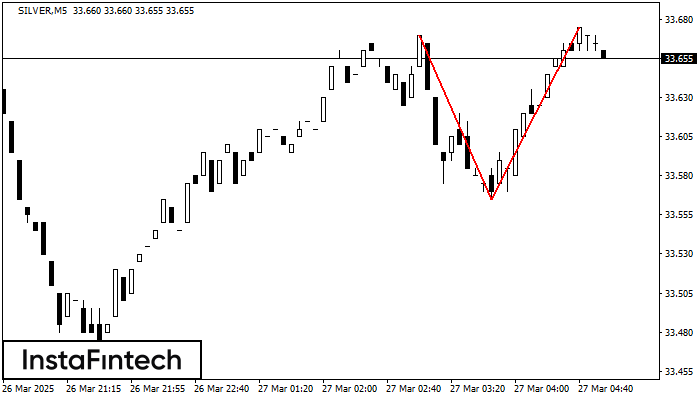
On the chart of SILVER M5 the Double Top reversal pattern has been formed. Characteristics: the upper boundary 33.67; the lower boundary 33.56; the width of the pattern 110 points
The M5 and M15 time frames may have more false entry points.
Open chart in a new window
Double Top
was formed on 27.03 at 04:40:34 (UTC+0)
signal strength 1 of 5
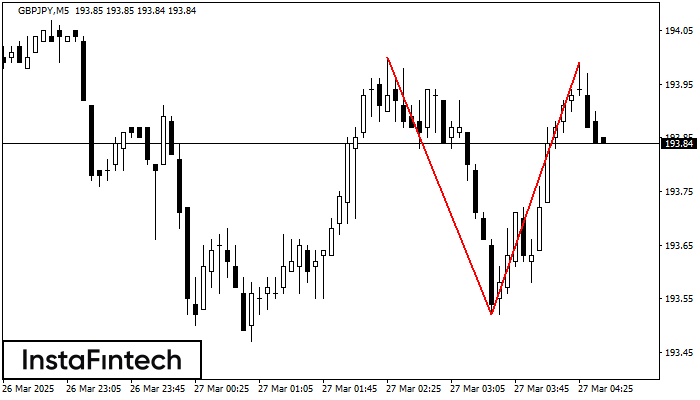
On the chart of GBPJPY M5 the Double Top reversal pattern has been formed. Characteristics: the upper boundary 193.99; the lower boundary 193.52; the width of the pattern 47 points
The M5 and M15 time frames may have more false entry points.
Open chart in a new window


