Vea también


 22.01.2025 07:28 AM
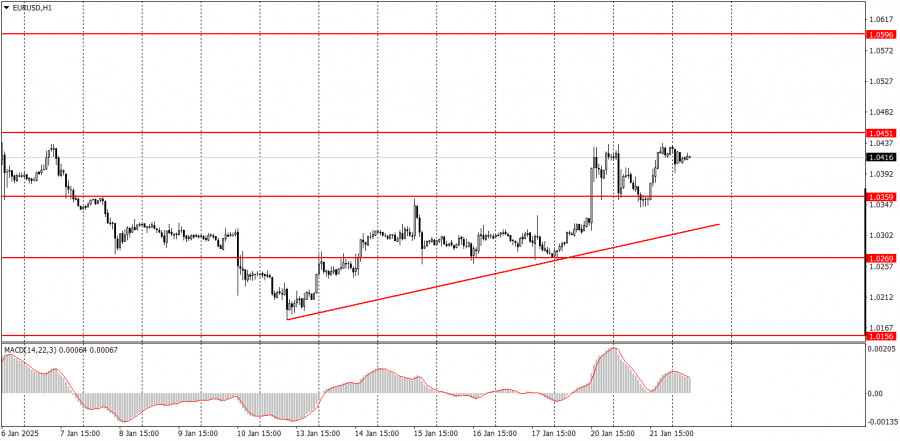
On Tuesday, the EUR/USD currency pair experienced significant movement in both directions. In the first half of the day, there was a noticeable decline, followed by a strong rise in the second half. There were no specific macroeconomic reasons for either the decline or the rise. Donald Trump continues to make bold statements; however, as previously mentioned, the market is likely to soon adapt to the reality that the U.S. President makes numerous declarations daily, most of which lack real-world significance. Therefore, we believe the market will stabilize and cease responding to Trump's proclamations. Currently, an upward correction is underway, supported by a trendline. Traders can use this trendline to help identify the end of the current correction. It is important to note that the broader trend remains bearish.
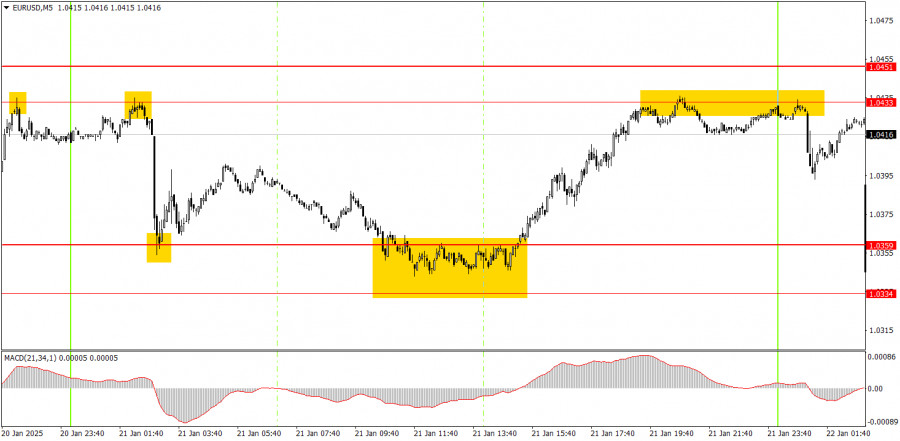
On the 5-minute timeframe on Tuesday, several excellent trading signals emerged. First, the price rebounded from the 1.0359 level, then from the 1.0334-1.0359 zone, eventually reaching the 1.0433 level. While the first signal likely did not yield profits for novice traders, it also didn't result in losses; however, it did occur overnight. The second signal generated a profit of around 50-60 pips. A short position could have been initiated based on the rebound from the 1.0334-1.0359 area, but this signal also emerged mostly overnight.
On the hourly timeframe, the EUR/USD pair is in a broader bearish trend, but the short-term trend is upward. We expect the euro's decline to resume in the medium term, with the pair approaching parity. The current economic and macroeconomic conditions continue to favor the U.S. dollar. This upward correction is supported by a trendline, and breaking below this trendline will indicate the end of the correction.
Movements on Wednesday may be significantly weaker compared to Monday and Tuesday, as the dollar could attempt to recover some of its losses. The trendline will serve as a key point of reference for traders.
On the 5-minute timeframe, the following levels should be considered: 1.0156, 1.0221, 1.0269-1.0277, 1.0334-1.0359, 1.0433-1.0451, 1.0526, 1.0596, 1.0678, 1.0726-1.0733, 1.0797-1.0804, and 1.0845-1.0851. Christine Lagarde is scheduled to give a speech in the European Union on Wednesday; however, it is unlikely to draw significant market attention under the current circumstances. Additionally, there are no scheduled events in America for that day.
Support and Resistance Levels: These are target levels for opening or closing positions and can also serve as points for placing Take Profit orders.
Red Lines: Channels or trendlines indicating the current trend and the preferred direction for trading.
MACD Indicator (14,22,3): A histogram and signal line used as a supplementary source of trading signals.
Important speeches and reports, which are consistently featured in the news calendar, can significantly influence the movement of a currency pair. Therefore, during their release, it is advisable to trade with caution or consider exiting the market to avoid potential sharp price reversals against the prior trend.
Beginners in the Forex market should understand that not every transaction will be profitable. Developing a clear trading strategy and practicing effective money management are crucial for achieving long-term success in trading.
You have already liked this post today
*El análisis de mercado publicado aquí tiene la finalidad de incrementar su conocimiento, más no darle instrucciones para realizar una operación.
GBP/USD: plan para la sesión europea del 9 de mayo. Informes COT (Commitment of Traders, análisis de las operaciones de ayer). La libra se desplomó tras la bajada de tasas
Ayer se formaron varios puntos de entrada al mercado. Veamos el gráfico de 5 minutos y analicemos lo que ocurrió. En mi pronóstico matutino presté atención al nivel de 1.1269
Ayer se formaron varios puntos de entrada al mercado. Veamos el gráfico de 5 minutos y analicemos lo que ocurrió. En mi pronóstico matutino presté atención al nivel 1.3335
Ayer se formaron varios puntos de entrada al mercado. Veamos el gráfico de 5 minutos y analicemos lo que ocurrió. En mi pronóstico matutino presté atención al nivel 1.1379
Ayer se formaron varios puntos de entrada al mercado. Veamos el gráfico de 5 minutos y analicemos lo que ocurrió allí. En mi pronóstico matutino presté atención al nivel 1.3282
Ayer se formaron varios puntos de entrada al mercado. Veamos el gráfico de 5 minutos y analicemos lo que ocurrió allí. En mi pronóstico matutino presté atención al nivel 1.1320
GBP/USD: plan para la sesión europea del 30 de abril. Informes Commitment of Traders COT (análisis de las operaciones de ayer). La libra se prepara para un nuevo salto, pero
Ayer se formó solo un punto de entrada al mercado. Veamos el gráfico de 5 minutos y analicemos lo que sucedió allí. En mi pronóstico de a mañana presté atención
Ayer se formaron varios puntos de entrada al mercado. Veamos el gráfico de 5 minutos y analicemos lo que ocurrió. En mi pronóstico matutino presté atención al nivel de 1.3342
Ayer no se formaron puntos de entrada al mercado. Propongo echar un vistazo al gráfico de 5 minutos y analizar lo que ocurrió. En mi pronóstico matutino, presté atención
Gráfico Forex
versión web

Your IP address shows that you are currently located in the USA. If you are a resident of the United States, you are prohibited from using the services of InstaFintech Group including online trading, online transfers, deposit/withdrawal of funds, etc.
If you think you are seeing this message by mistake and your location is not the US, kindly proceed to the website. Otherwise, you must leave the website in order to comply with government restrictions.
Why does your IP address show your location as the USA?
Please confirm whether you are a US resident or not by clicking the relevant button below. If you choose the wrong option, being a US resident, you will not be able to open an account with InstaTrade anyway.
We are sorry for any inconvenience caused by this message.


