Vea también

 22.10.2024 03:20 AM
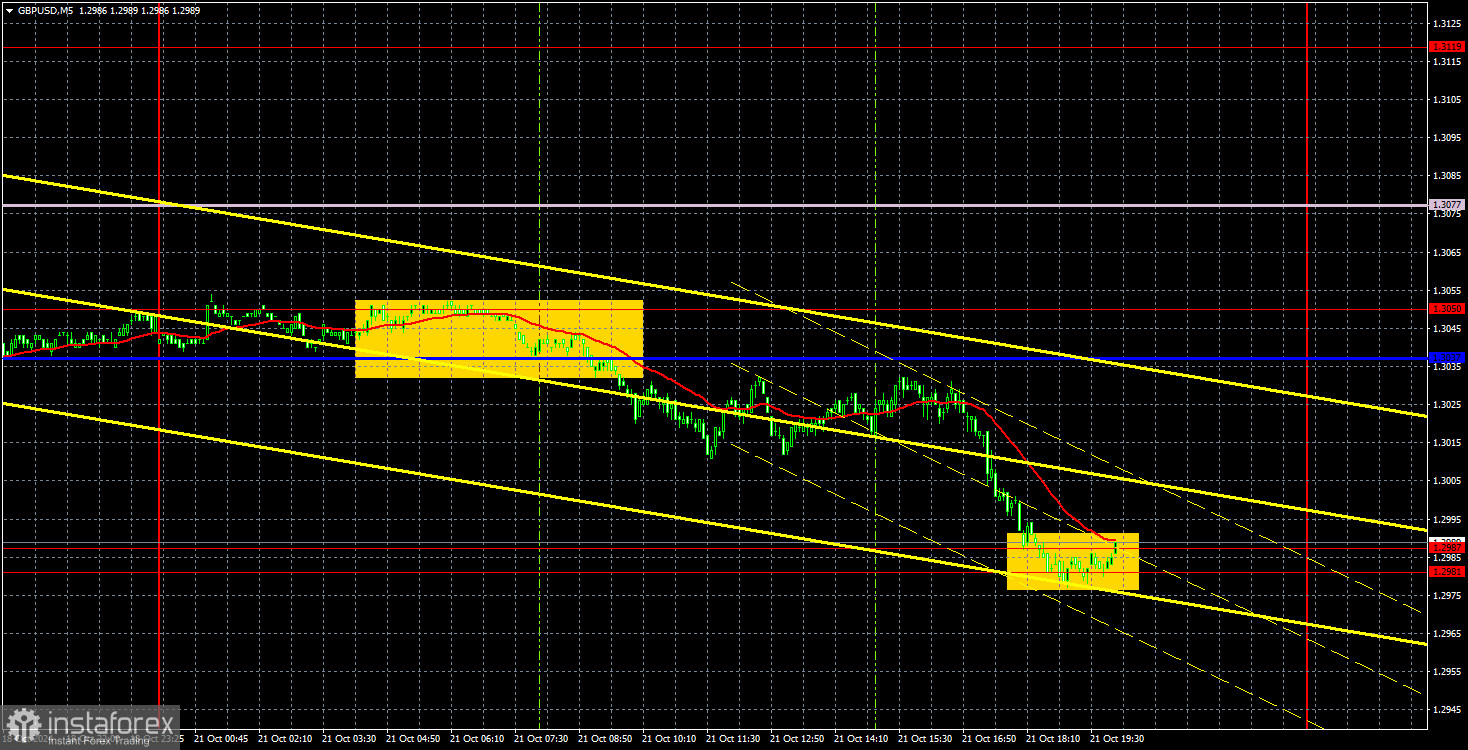
On Monday, the GBP/USD currency pair continued its downward movement despite no apparent reasons for it. By this, we mean there were no local macroeconomic or fundamental factors. In simple terms, Monday had no significant speeches or releases. Nevertheless, the pound fell sharply, losing around 50 pips it had gained at the end of the previous week. By the end of the day, it was back in the 1.2981-1.2987 area, where a local "bottom" had formed last week. This area and the psychological level of $1.30 are currently holding the pound back from further decline. However, the fact that the price attempts to consolidate below this area for the second time indicates intense pressure from the bears. It's also worth noting that there was no local reason for the market to sell the pound yesterday except for broader global factors. Instead of a "quiet Monday," we witnessed a "quite active Monday." This suggests that traders, as before, are ready to sell off the pound without local reasons.
This market behavior doesn't surprise us. We have repeatedly said that the pound is overbought and unjustifiably expensive, so it is bound to decline. And now it is falling. It has declined for three weeks straight like the dollar had dropped before—without clear, local reasons. We believe that breaking through the $1.30 level is only a matter of time.
Regarding trading signals, at the European trading session yesterday, the price consolidated below the area formed by the 1.3050 level and the Kijun-sen line, subsequently reaching the 1.2981-1.2987 area. Traders could have quickly capitalized on this move with a short position.
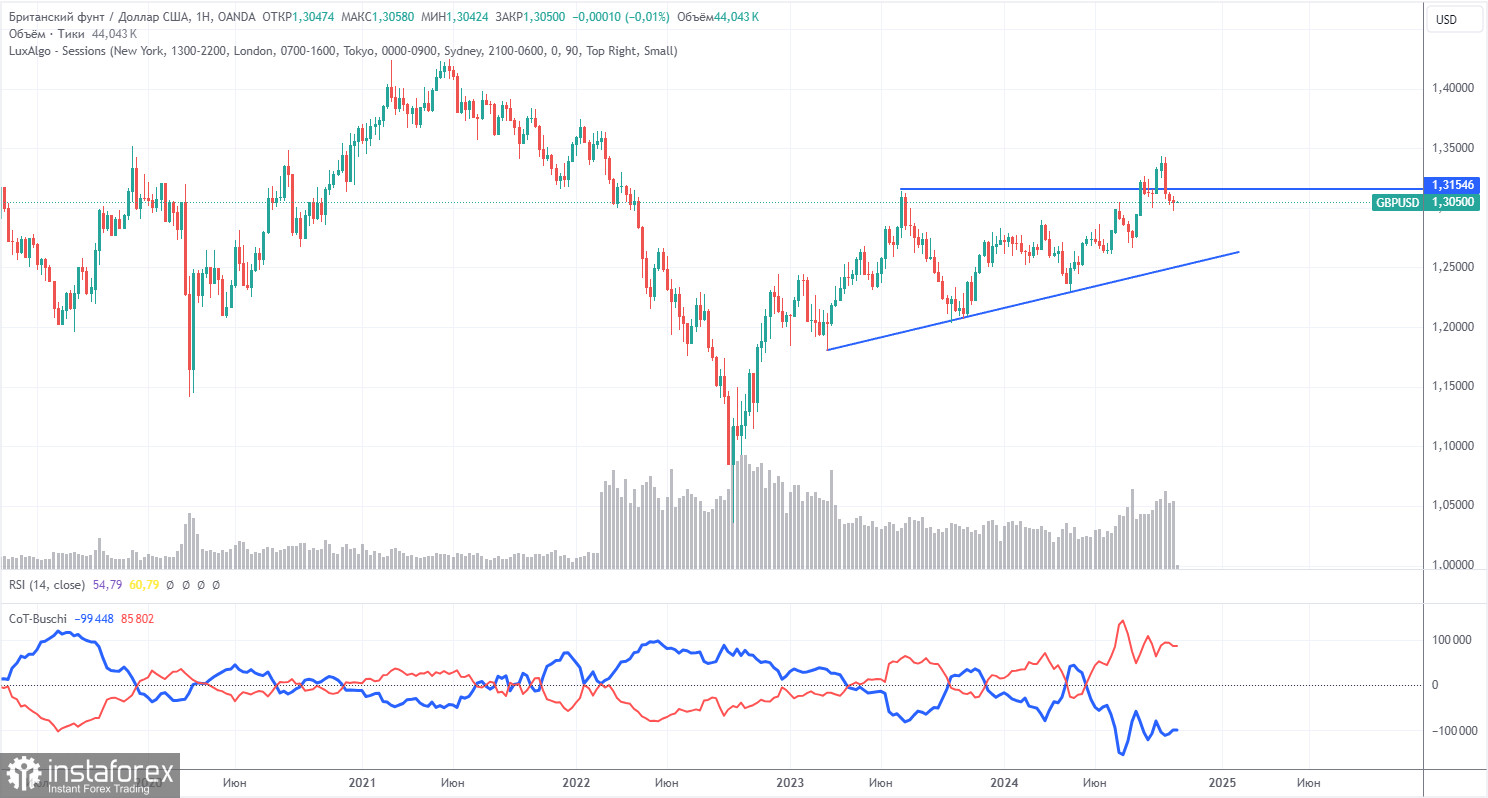
The COT (Commitment of Traders) reports on the British pound show that the sentiment among commercial traders has been constantly changing over the years. The red and blue lines, representing the net positions of commercial and non-commercial traders, frequently intersect and mostly hover around the zero mark. We also see that the last downward trend occurred when the red line was below zero. The red line is above zero, while the price has broken through the significant 1.3154 level.
According to the latest COT report on the British pound, the non-commercial group closed 5,700 BUY contracts and opened 1,600 SELL contracts. Thus, the net position of non-commercial traders decreased by 7,300 contracts over the week. The market still seems hesitant to sell the British pound...
The fundamental backdrop still does not provide any basis for long-term purchases of the British pound, and the currency has a real chance to resume a global downward trend. However, there is an ascending trend line in the weekly timeframe, so until it is broken, a long-term decline in the pound is not anticipated. The pound has been rising against almost all odds, even when the COT reports indicate that major players are selling the pound.
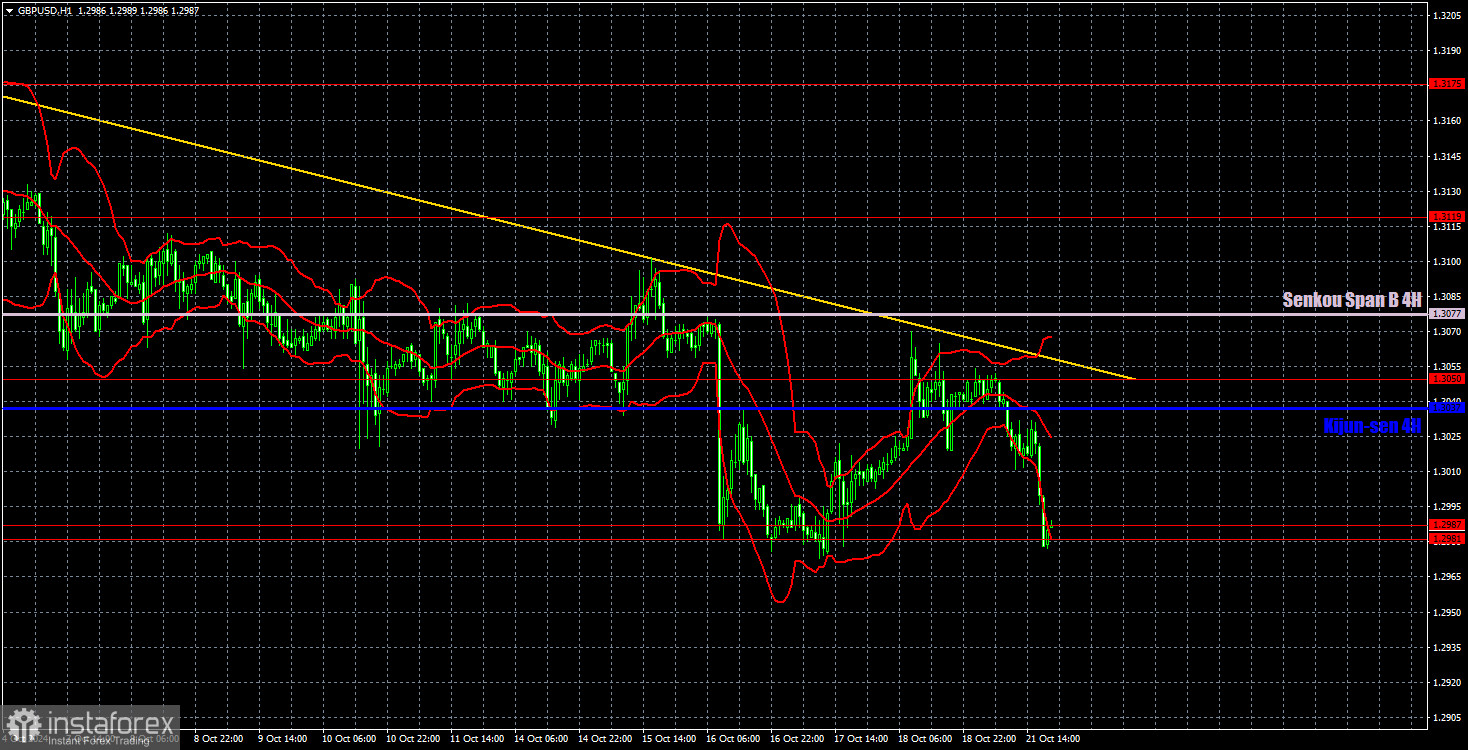
The GBP/USD pair continues to fall in the hourly time frame. The upward trend has been canceled, so further declines in the British currency are expected and could be significant and prolonged. Currently, traders need to break below the 1.3000 level or the trend line along with the Senkou Span B line. In the first scenario, further declines in the pound should be anticipated, which could be as strong as the initial drop. In the second scenario, a correction could be expected.
We highlight the following important levels for October 22: 1.2796-1.2816, 1.2863, 1.2981-1.2987, 1.3050, 1.3119, 1.3175, 1.3222, 1.3273, 1.3367, 1.3439. The Senkou Span B line (1.3077) and the Kijun-sen line (1.3037) may also serve as sources of signals. It is recommended to place a Stop Loss at break even when the price moves 20 pips in the intended direction to protect against potential losses if the signal turns out to be false. The lines of the Ichimoku indicator may shift throughout the day, which should be considered when determining trading signals.
On Tuesday, no significant events are scheduled in the UK or the US, so traders will have little to react to during the day. However, as Monday showed, movements do not necessarily have to be boring. Today, the price might attempt another bounce from the 1.2981-1.2987 area before breaking through it on a third attempt. In any case, a consolidation below this area would signal further declines for the pound.
Support and resistance levels: thick red lines around which movement may end. They are not sources of trading signals.
Kijun-sen and Senkou Span B lines: Ichimoku indicator lines transferred to the hourly timeframe from the 4-hour chart. They are strong lines.
Extreme levels: thin red lines where the price previously rebounded. They are sources of trading signals.
Yellow lines: trend lines, trend channels, and other technical patterns.
Indicator 1 on COT charts: net position size of each trader category.
You have already liked this post today
*El análisis de mercado publicado aquí tiene la finalidad de incrementar su conocimiento, más no darle instrucciones para realizar una operación.


