

Actual patterns

Patterns are graphical models which are formed in the chart by the price. According to one of the technical analysis postulates, history (price movement) repeats itself. It means that the price movements are often similar in the same situations which makes it possible to predict the further development of the situation with a high probability.
Relevant patterns by InstaTrade is an easy-to-use service which allows you to be aware of latest changes in the market and react to clues from the market in time. In our service you will always find the latest and most relevant patterns on any pair and any timeframe.
Bullish pennant
was formed on 14.04 at 16:00:24 (UTC+0)
signal strength 1 of 5
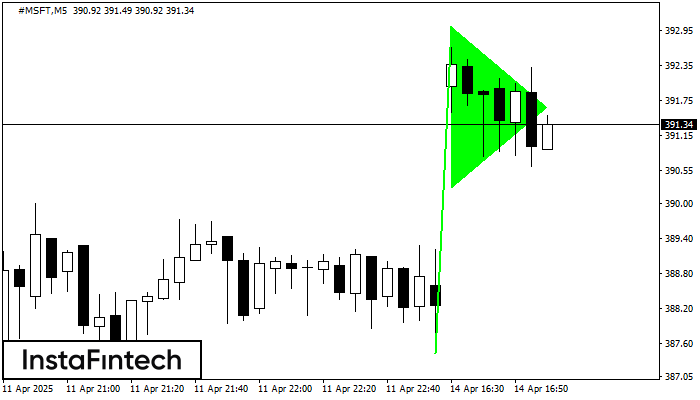
The Bullish pennant pattern is formed on the #MSFT M5 chart. It is a type of the continuation pattern. Supposedly, in case the price is fixed above the pennant’s high of 393.01, a further uptrend is possible.
The M5 and M15 time frames may have more false entry points.
See Also
- All
- All
- Bearish Rectangle
- Bearish Symmetrical Triangle
- Bearish Symmetrical Triangle
- Bullish Rectangle
- Double Top
- Double Top
- Triple Bottom
- Triple Bottom
- Triple Top
- Triple Top
- All
- All
- Buy
- Sale
- All
- 1
- 2
- 3
- 4
- 5
Head and Shoulders
сформирован 13.05 в 14:00:05 (UTC+0)
сила сигнала 2 из 5
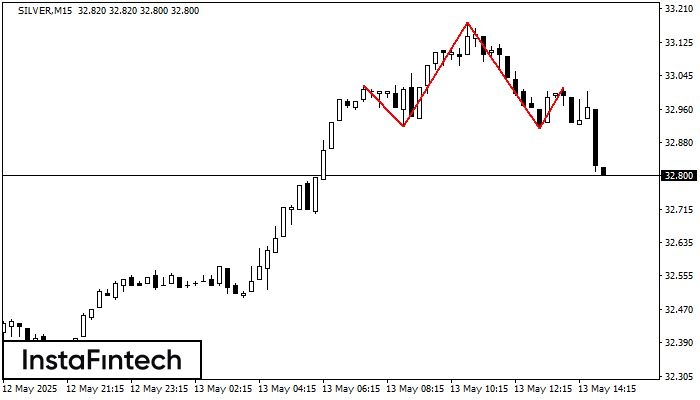
According to the chart of M15, SILVER formed the Head and Shoulders pattern. The Head’s top is set at 33.17 while the median line of the Neck is found
The M5 and M15 time frames may have more false entry points.
Открыть график инструмента в новом окне
Bearish Symmetrical Triangle
сформирован 13.05 в 13:59:40 (UTC+0)
сила сигнала 2 из 5

According to the chart of M15, NZDCHF formed the Bearish Symmetrical Triangle pattern. Trading recommendations: A breach of the lower border 0.4931 is likely to encourage a continuation
The M5 and M15 time frames may have more false entry points.
Открыть график инструмента в новом окне
Double Bottom
сформирован 13.05 в 11:06:34 (UTC+0)
сила сигнала 1 из 5
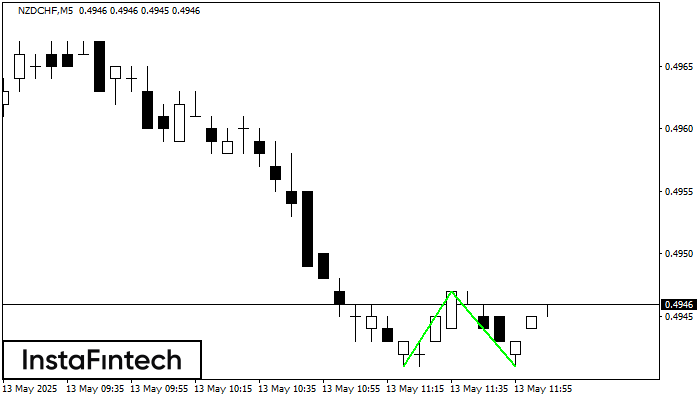
The Double Bottom pattern has been formed on NZDCHF M5; the upper boundary is 0.4947; the lower boundary is 0.4941. The width of the pattern is 6 points. In case
The M5 and M15 time frames may have more false entry points.
Открыть график инструмента в новом окне


