

Actual patterns

Patterns are graphical models which are formed in the chart by the price. According to one of the technical analysis postulates, history (price movement) repeats itself. It means that the price movements are often similar in the same situations which makes it possible to predict the further development of the situation with a high probability.
Relevant patterns by InstaTrade is an easy-to-use service which allows you to be aware of latest changes in the market and react to clues from the market in time. In our service you will always find the latest and most relevant patterns on any pair and any timeframe.
Bullish Symmetrical Triangle
was formed on 01.04 at 13:20:50 (UTC+0)
signal strength 2 of 5
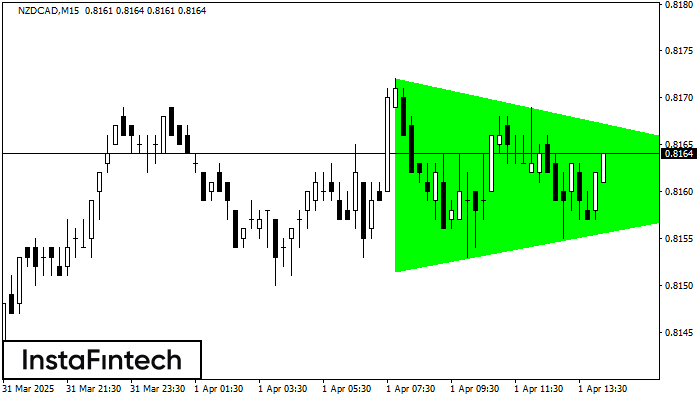
According to the chart of M15, NZDCAD formed the Bullish Symmetrical Triangle pattern. Description: This is the pattern of a trend continuation. 0.8172 and 0.8152 are the coordinates of the upper and lower borders respectively. The pattern width is measured on the chart at 20 pips. Outlook: If the upper border 0.8172 is broken, the price is likely to continue its move by 0.8184.
The M5 and M15 time frames may have more false entry points.
- All
- All
- Bearish Rectangle
- Bearish Symmetrical Triangle
- Bearish Symmetrical Triangle
- Bullish Rectangle
- Double Top
- Double Top
- Triple Bottom
- Triple Bottom
- Triple Top
- Triple Top
- All
- All
- Buy
- Sale
- All
- 1
- 2
- 3
- 4
- 5
Triple Top
сформирован 25.04 в 08:30:10 (UTC+0)
сила сигнала 1 из 5
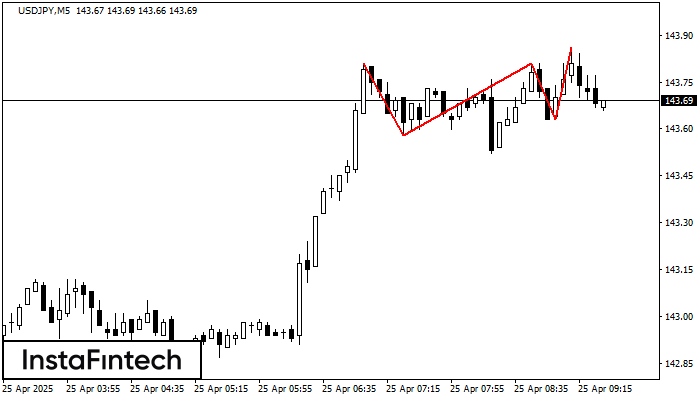
On the chart of the USDJPY M5 trading instrument, the Triple Top pattern that signals a trend change has formed. It is possible that after formation of the third peak
The M5 and M15 time frames may have more false entry points.
Открыть график инструмента в новом окне
Inverse Head and Shoulder
сформирован 25.04 в 08:30:00 (UTC+0)
сила сигнала 2 из 5
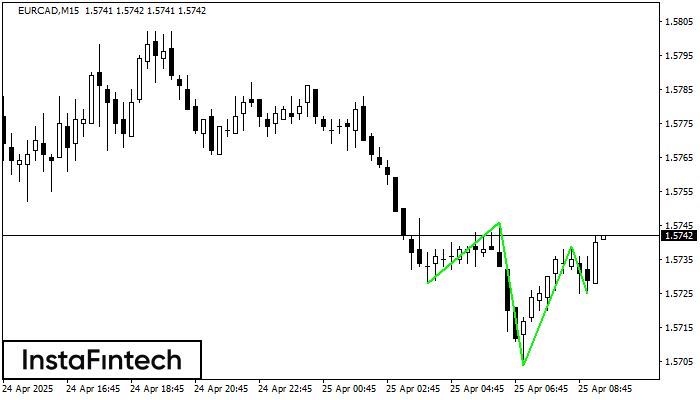
According to M15, EURCAD is shaping the technical pattern – the Inverse Head and Shoulder. In case the Neckline 1.5746/1.5739 is broken out, the instrument is likely to move toward
The M5 and M15 time frames may have more false entry points.
Открыть график инструмента в новом окне
Triple Bottom
сформирован 25.04 в 07:41:10 (UTC+0)
сила сигнала 1 из 5
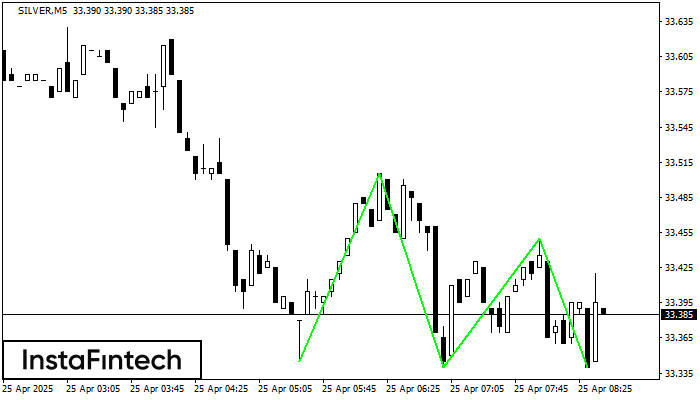
The Triple Bottom pattern has been formed on SILVER M5. It has the following characteristics: resistance level 33.51/33.45; support level 33.34/33.34; the width is 160 points. In the event
The M5 and M15 time frames may have more false entry points.
Открыть график инструмента в новом окне


