

Actual patterns

Patterns are graphical models which are formed in the chart by the price. According to one of the technical analysis postulates, history (price movement) repeats itself. It means that the price movements are often similar in the same situations which makes it possible to predict the further development of the situation with a high probability.
Relevant patterns by InstaTrade is an easy-to-use service which allows you to be aware of latest changes in the market and react to clues from the market in time. In our service you will always find the latest and most relevant patterns on any pair and any timeframe.
Double Bottom
was formed on 31.03 at 14:45:14 (UTC+0)
signal strength 2 of 5
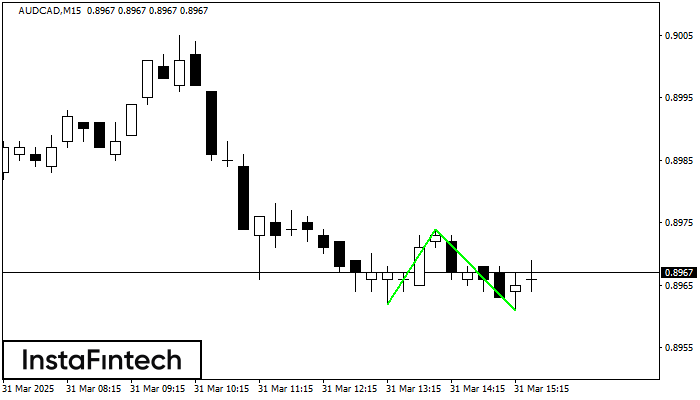
The Double Bottom pattern has been formed on AUDCAD M15. Characteristics: the support level 0.8962; the resistance level 0.8974; the width of the pattern 12 points. If the resistance level is broken, a change in the trend can be predicted with the first target point lying at the distance of 13 points.
The M5 and M15 time frames may have more false entry points.
- All
- All
- Bearish Rectangle
- Bearish Symmetrical Triangle
- Bearish Symmetrical Triangle
- Bullish Rectangle
- Double Top
- Double Top
- Triple Bottom
- Triple Bottom
- Triple Top
- Triple Top
- All
- All
- Buy
- Sale
- All
- 1
- 2
- 3
- 4
- 5
Fundo duplo
was formed on 14.04 at 22:00:04 (UTC+0)
signal strength 3 of 5
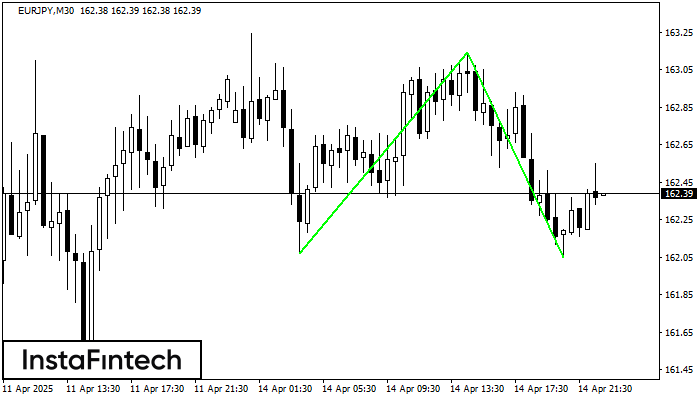
O padrão Fundo duplo foi formado em EURJPY M30; o limite superior é 163.14; o limite inferior é 162.05. A largura do padrão é de 107 pontos. No caso
Open chart in a new window
Fundo duplo
was formed on 14.04 at 22:00:04 (UTC+0)
signal strength 1 of 5
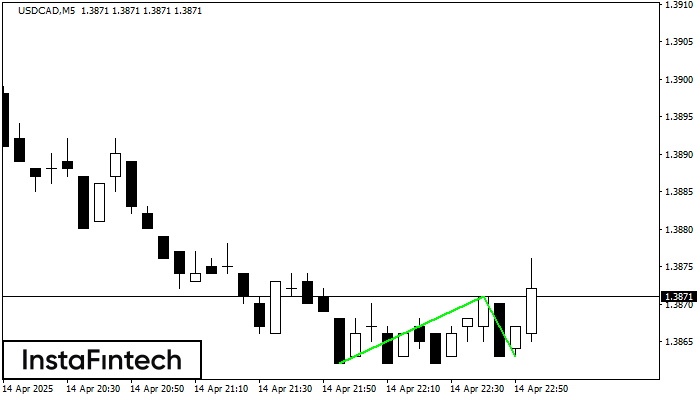
O padrão Fundo duplo foi formado em USDCAD M5. Características: o nível de suporte 1.3862; o nível de resistência 1.3871; a largura do padrão 9 pontos. Se o nível
Os intervalos M5 e M15 podem ter mais pontos de entrada falsos.
Open chart in a new window
Triângulo Simétrico de Baixa
was formed on 14.04 at 21:53:03 (UTC+0)
signal strength 1 of 5
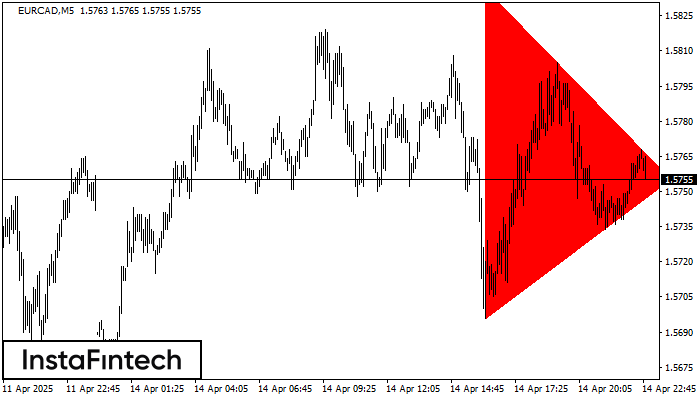
De acordo com o gráfico de M5, EURCAD fomrou o padrão de Triângulo Simétrico de Baixa. Este padrão sinaliza uma nova tendência de baixa se o limite inferior 1.5696
Os intervalos M5 e M15 podem ter mais pontos de entrada falsos.
Open chart in a new window


