Actual patterns

Patterns are graphical models which are formed in the chart by the price. According to one of the technical analysis postulates, history (price movement) repeats itself. It means that the price movements are often similar in the same situations which makes it possible to predict the further development of the situation with a high probability.
Relevant patterns by InstaTrade is an easy-to-use service which allows you to be aware of latest changes in the market and react to clues from the market in time. In our service you will always find the latest and most relevant patterns on any pair and any timeframe.
Triple Bottom
was formed on 28.03 at 20:05:30 (UTC+0)
signal strength 1 of 5
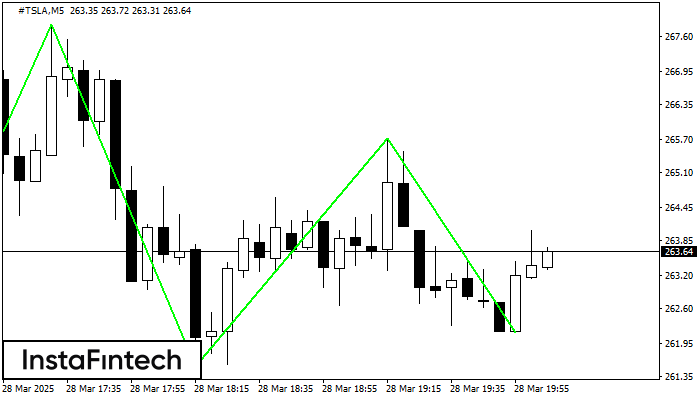
The Triple Bottom pattern has been formed on #TSLA M5. It has the following characteristics: resistance level 267.82/265.73; support level 260.65/262.15; the width is 717 points. In the event of a breakdown of the resistance level of 267.82, the price is likely to continue an upward movement at least to 261.68.
The M5 and M15 time frames may have more false entry points.
- All
- All
- Bearish Rectangle
- Bearish Symmetrical Triangle
- Bearish Symmetrical Triangle
- Bullish Rectangle
- Double Top
- Double Top
- Triple Bottom
- Triple Bottom
- Triple Top
- Triple Top
- All
- All
- Buy
- Sale
- All
- 1
- 2
- 3
- 4
- 5
Bullish pennant
was formed on 25.04 at 16:14:55 (UTC+0)
signal strength 2 of 5
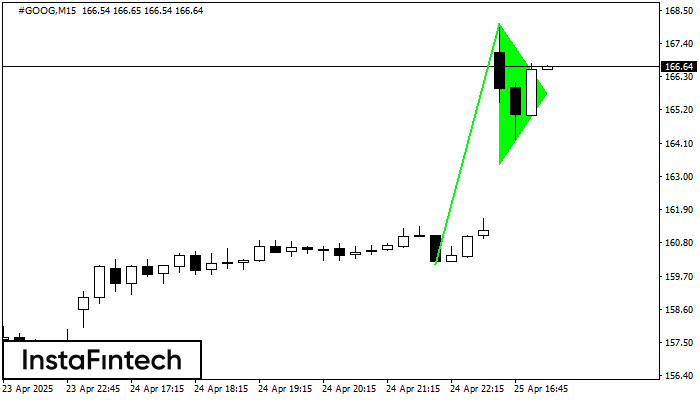
The Bullish pennant signal – Trading instrument #GOOG M15, continuation pattern. Forecast: it is possible to set up a buy position above the pattern’s high of 168.07, with the prospect
The M5 and M15 time frames may have more false entry points.
Open chart in a new window
Double Bottom
was formed on 25.04 at 15:59:55 (UTC+0)
signal strength 2 of 5
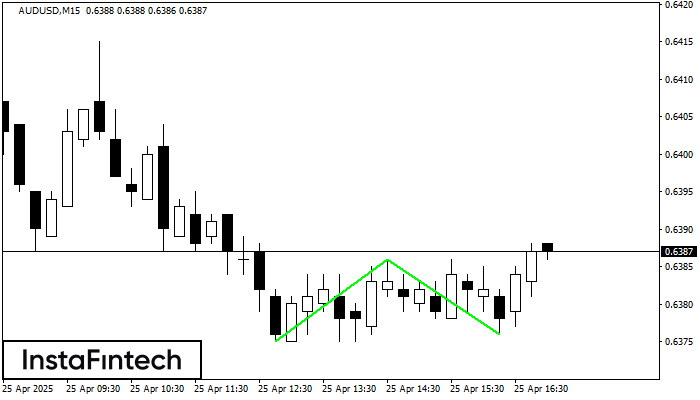
The Double Bottom pattern has been formed on AUDUSD M15; the upper boundary is 0.6386; the lower boundary is 0.6376. The width of the pattern is 11 points. In case
The M5 and M15 time frames may have more false entry points.
Open chart in a new window
Triple Top
was formed on 25.04 at 15:34:40 (UTC+0)
signal strength 1 of 5
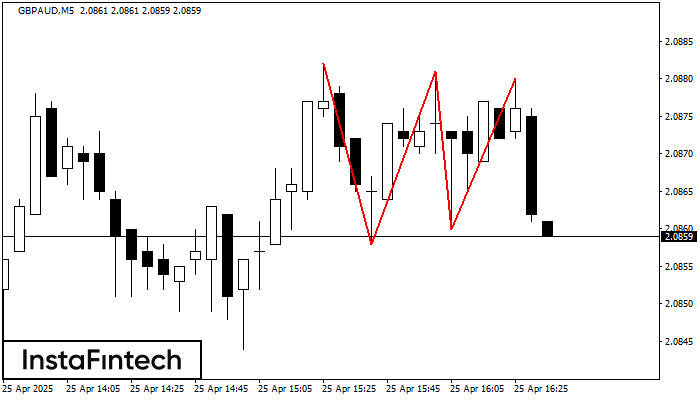
The Triple Top pattern has formed on the chart of the GBPAUD M5. Features of the pattern: borders have an ascending angle; the lower line of the pattern
The M5 and M15 time frames may have more false entry points.
Open chart in a new window