Актуальные паттерны

Паттерны – это графические модели, которые "рисует" цена на графике. Один из постулатов технического анализа говорит нам о том, что история (движение цены) всегда повторяется. Это значит, что в похожих ситуациях движение цены, зачастую, будет похожим, что позволяет с высокой долей вероятности спрогнозировать дальнейшее развитие ситуации.
Актуальные паттерны от ИнстаФорекс – это удобный сервис, который позволит вам всегда быть в курсе последних изменений на рынке и вовремя реагировать на появившиеся подсказки от рынка. В нашем сервисе вы всегда найдете самые свежие и актуальные паттерны на любой паре и на любом таймфрейме.
Прямоугольник
сформирован 14.04 в 08:47:26 (UTC+0)
сила сигнала 1 из 5
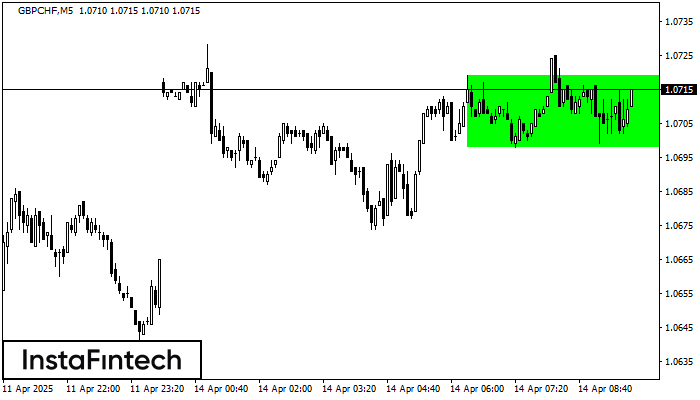
По торговому инструменту GBPCHF на M5 сформировалась фигура продолжения тренда - «Прямоугольник». Фигура имеет границы: Нижняя 1.0698; Верхняя 1.0719. В случае пробоя верхней границы вероятно дальнейшее движение в сторону тренда.
Таймфреймы М5 и М15 могут иметь больше ложных точек входа.
- Все
- Все
- Bearish Rectangle
- Bearish Symmetrical Triangle
- Bearish Symmetrical Triangle
- Bullish Rectangle
- Double Top
- Double Top
- Triple Bottom
- Triple Bottom
- Triple Top
- Triple Top
- Все
- Все
- Покупка
- Продажа
- Все
- 1
- 2
- 3
- 4
- 5
Double Bottom
was formed on 21.05 at 06:45:15 (UTC+0)
signal strength 2 of 5
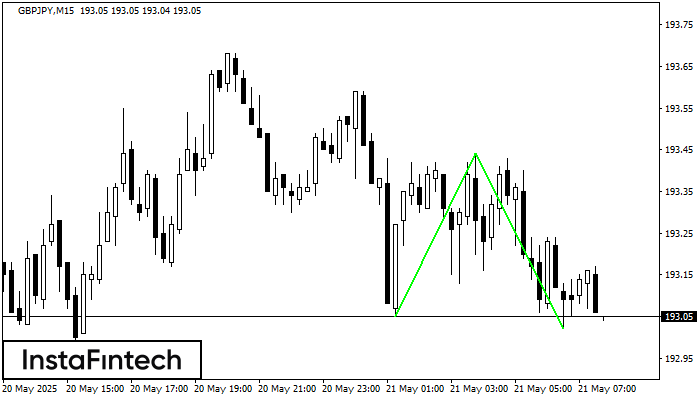
The Double Bottom pattern has been formed on GBPJPY M15; the upper boundary is 193.44; the lower boundary is 193.02. The width of the pattern is 39 points. In case
The M5 and M15 time frames may have more false entry points.
Open chart in a new window
Bearish Symmetrical Triangle
was formed on 21.05 at 06:17:36 (UTC+0)
signal strength 3 of 5
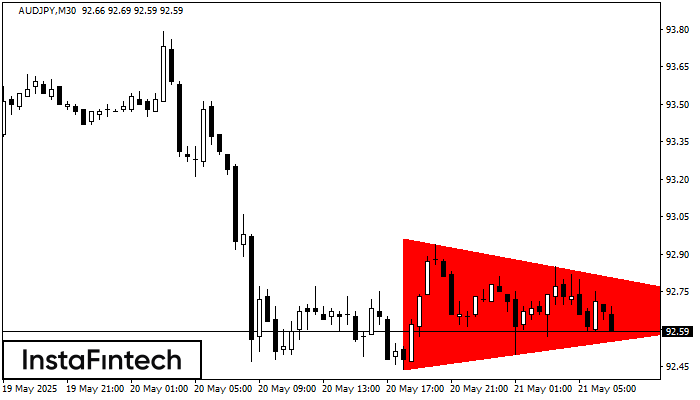
According to the chart of M30, AUDJPY formed the Bearish Symmetrical Triangle pattern. Description: The lower border is 92.44/92.66 and upper border is 92.96/92.66. The pattern width is measured
Open chart in a new window
Double Bottom
was formed on 21.05 at 06:05:21 (UTC+0)
signal strength 1 of 5
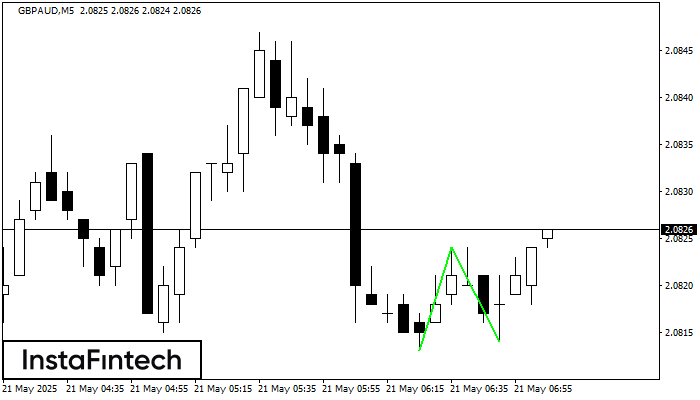
The Double Bottom pattern has been formed on GBPAUD M5; the upper boundary is 2.0824; the lower boundary is 2.0814. The width of the pattern is 11 points. In case
The M5 and M15 time frames may have more false entry points.
Open chart in a new window