Актуальные паттерны

Паттерны – это графические модели, которые "рисует" цена на графике. Один из постулатов технического анализа говорит нам о том, что история (движение цены) всегда повторяется. Это значит, что в похожих ситуациях движение цены, зачастую, будет похожим, что позволяет с высокой долей вероятности спрогнозировать дальнейшее развитие ситуации.
Актуальные паттерны от ИнстаФорекс – это удобный сервис, который позволит вам всегда быть в курсе последних изменений на рынке и вовремя реагировать на появившиеся подсказки от рынка. В нашем сервисе вы всегда найдете самые свежие и актуальные паттерны на любой паре и на любом таймфрейме.
Двойная вершина
сформирован 02.04 в 09:30:23 (UTC+0)
сила сигнала 3 из 5
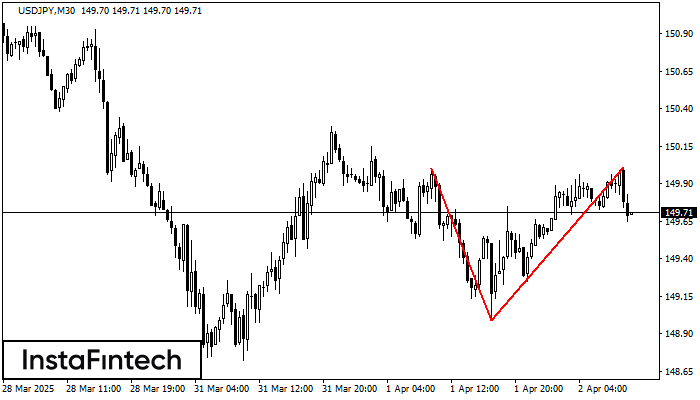
По USDJPY на M30 сформировалась разворотная фигура «Двойная вершина». Характеристика: Верхняя граница 150.00; Нижняя граница 148.99; Ширина фигуры 102 пунктов. Позицию на продажу возможно открыть ниже нижней границы 148.99, с перспективой хода к уровню 148.69.
Смотрите также
- Все
- Все
- Bearish Rectangle
- Bearish Symmetrical Triangle
- Bearish Symmetrical Triangle
- Bullish Rectangle
- Double Top
- Double Top
- Triple Bottom
- Triple Bottom
- Triple Top
- Triple Top
- Все
- Все
- Покупка
- Продажа
- Все
- 1
- 2
- 3
- 4
- 5
Bullish Symmetrical Triangle
was formed on 19.05 at 02:33:43 (UTC+0)
signal strength 1 of 5
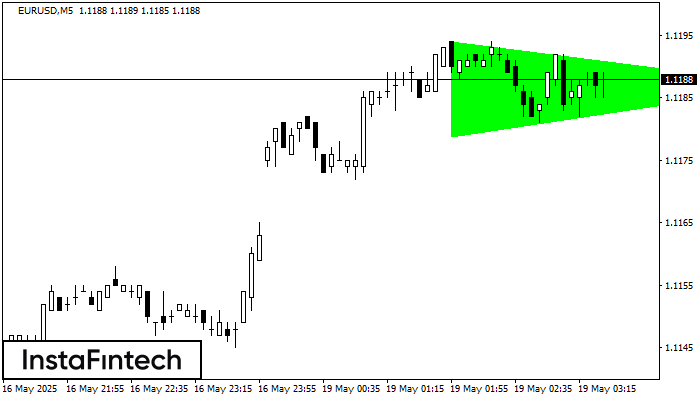
According to the chart of M5, EURUSD formed the Bullish Symmetrical Triangle pattern. Description: This is the pattern of a trend continuation. 1.1194 and 1.1179 are the coordinates
The M5 and M15 time frames may have more false entry points.
Open chart in a new window
Bullish Symmetrical Triangle
was formed on 19.05 at 02:04:32 (UTC+0)
signal strength 1 of 5
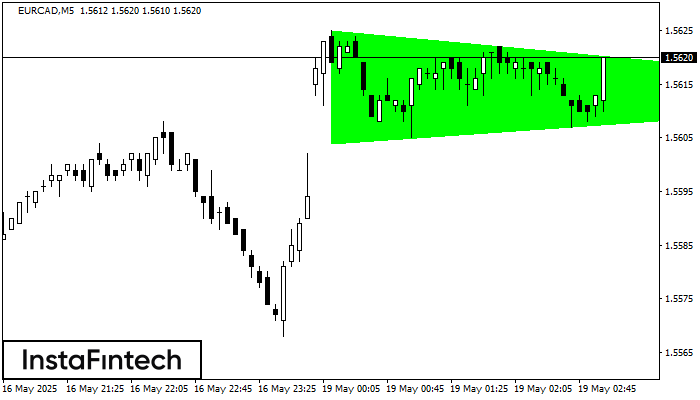
According to the chart of M5, EURCAD formed the Bullish Symmetrical Triangle pattern. Description: This is the pattern of a trend continuation. 1.5625 and 1.5604 are the coordinates
The M5 and M15 time frames may have more false entry points.
Open chart in a new window
Bearish Rectangle
was formed on 19.05 at 01:03:37 (UTC+0)
signal strength 1 of 5
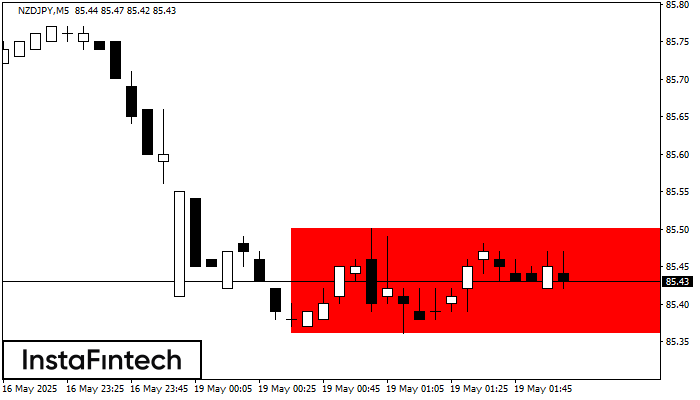
According to the chart of M5, NZDJPY formed the Bearish Rectangle. The pattern indicates a trend continuation. The upper border is 85.50, the lower border is 85.36. The signal means
The M5 and M15 time frames may have more false entry points.
Open chart in a new window