Актуальные паттерны

Паттерны – это графические модели, которые "рисует" цена на графике. Один из постулатов технического анализа говорит нам о том, что история (движение цены) всегда повторяется. Это значит, что в похожих ситуациях движение цены, зачастую, будет похожим, что позволяет с высокой долей вероятности спрогнозировать дальнейшее развитие ситуации.
Актуальные паттерны от ИнстаФорекс – это удобный сервис, который позволит вам всегда быть в курсе последних изменений на рынке и вовремя реагировать на появившиеся подсказки от рынка. В нашем сервисе вы всегда найдете самые свежие и актуальные паттерны на любой паре и на любом таймфрейме.
Медвежий симметричный треугольник
сформирован 01.04 в 09:09:30 (UTC+0)
сила сигнала 3 из 5
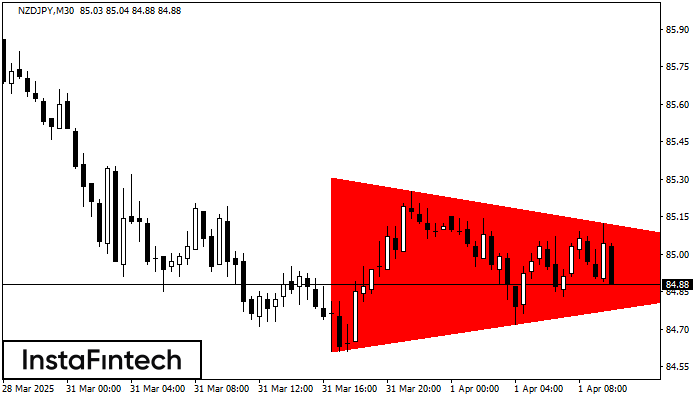
По NZDJPY M30 сформировалась фигура «Медвежий симметричный треугольник». Данная фигура сигнализирует нам о продолжении нисходящего тренда в случае пробоя нижней границы 84.61, где вероятная прибыль будет являться шириной текущей фигуры -69 пунктов.
Смотрите также
- Все
- Все
- Bearish Rectangle
- Bearish Symmetrical Triangle
- Bearish Symmetrical Triangle
- Bullish Rectangle
- Double Top
- Double Top
- Triple Bottom
- Triple Bottom
- Triple Top
- Triple Top
- Все
- Все
- Покупка
- Продажа
- Все
- 1
- 2
- 3
- 4
- 5
Head and Shoulders
was formed on 14.04 at 05:15:40 (UTC+0)
signal strength 1 of 5

According to the chart of M5, EURCAD formed the Head and Shoulders pattern. The Head’s top is set at 1.5811 while the median line of the Neck is found
The M5 and M15 time frames may have more false entry points.
Open chart in a new window
Double Bottom
was formed on 14.04 at 04:45:49 (UTC+0)
signal strength 1 of 5

The Double Bottom pattern has been formed on NZDCAD M5. This formation signals a reversal of the trend from downwards to upwards. The signal is that a buy trade should
The M5 and M15 time frames may have more false entry points.
Open chart in a new window
Bullish Rectangle
was formed on 14.04 at 04:08:09 (UTC+0)
signal strength 2 of 5
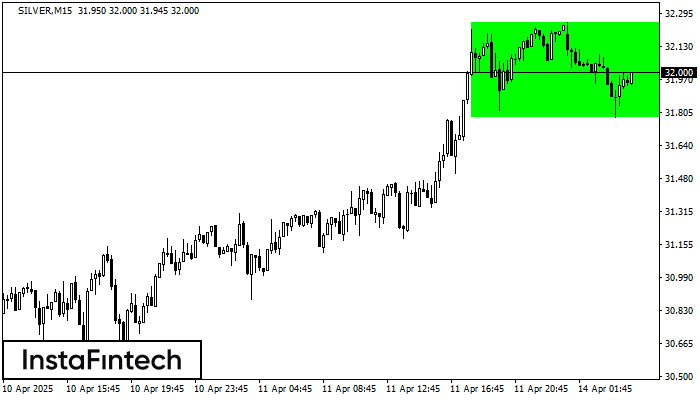
According to the chart of M15, SILVER formed the Bullish Rectangle. This type of a pattern indicates a trend continuation. It consists of two levels: resistance 32.25 and support 31.78
The M5 and M15 time frames may have more false entry points.
Open chart in a new window