Актуальные паттерны

Паттерны – это графические модели, которые "рисует" цена на графике. Один из постулатов технического анализа говорит нам о том, что история (движение цены) всегда повторяется. Это значит, что в похожих ситуациях движение цены, зачастую, будет похожим, что позволяет с высокой долей вероятности спрогнозировать дальнейшее развитие ситуации.
Актуальные паттерны от ИнстаФорекс – это удобный сервис, который позволит вам всегда быть в курсе последних изменений на рынке и вовремя реагировать на появившиеся подсказки от рынка. В нашем сервисе вы всегда найдете самые свежие и актуальные паттерны на любой паре и на любом таймфрейме.
Тройная вершина
сформирован 30.03 в 11:20:04 (UTC+0)
сила сигнала 1 из 5

На графике #Bitcoin M5 образовалась фигура «Тройная вершина». Данная фигура относится к типу разворотных и имеет характеристику: Верхняя граница 83279.90/83362.12; Нижняя граница 82818.73/83017.25; Ширина фигуры 26713 пунктов. Прогноз: В случае пробоя нижней границы 82818.73 вероятно дальнейшее нисходящее движение к уровню 83284.23.
Таймфреймы М5 и М15 могут иметь больше ложных точек входа.
- Все
- Все
- Bearish Rectangle
- Bearish Symmetrical Triangle
- Bearish Symmetrical Triangle
- Bullish Rectangle
- Double Top
- Double Top
- Triple Bottom
- Triple Bottom
- Triple Top
- Triple Top
- Все
- Все
- Покупка
- Продажа
- Все
- 1
- 2
- 3
- 4
- 5
Двойное дно
сформирован 21.05 в 09:30:46 (UTC+0)
сила сигнала 2 из 5
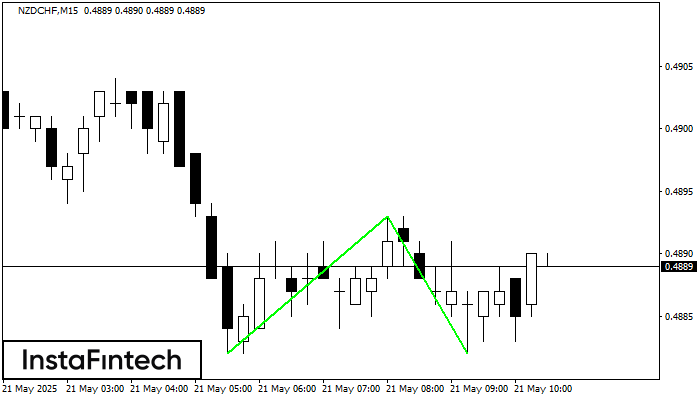
Сформирована фигура «Двойное дно» на графике NZDCHF M15. Характеристика: Уровень поддержки 0.4882; Уровень сопротивления 0.4893; Ширина фигуры 11 пунктов. В случае пробоя уровня сопротивления можно будет прогнозировать изменение тенденции
Таймфреймы М5 и М15 могут иметь больше ложных точек входа.
Открыть график инструмента в новом окне
Двойная вершина
сформирован 21.05 в 09:30:33 (UTC+0)
сила сигнала 3 из 5
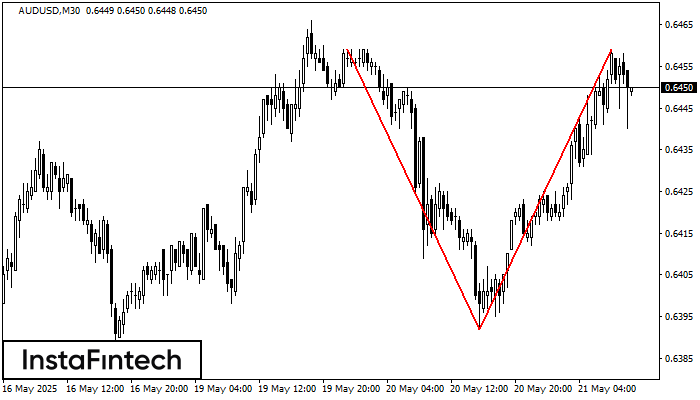
По торговому инструменту AUDUSD на M30 сформировалась фигура «Двойная вершина», которая сигнализирует нам об изменении тенденции с восходящей на нисходящую. Вероятно, что, в случае пробоя основания фигуры 0.6392, возможно дальнейшее
Открыть график инструмента в новом окне
Двойная вершина
сформирован 21.05 в 09:30:25 (UTC+0)
сила сигнала 2 из 5
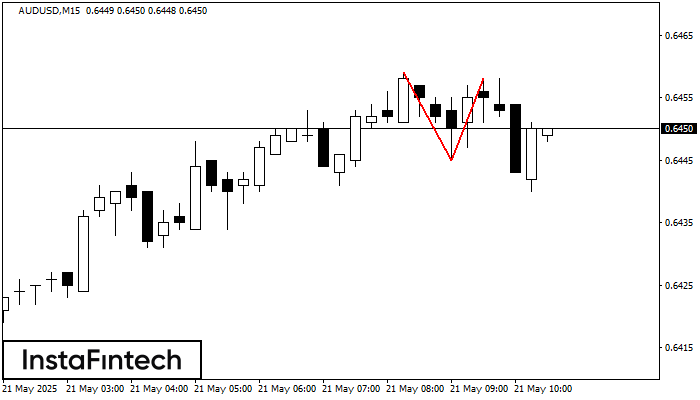
На торговом графике AUDUSD M15 сформировалась разворотная фигура «Двойная вершина». Характеристика: Верхняя граница 0.6458; Нижняя граница 0.6445; Ширина фигуры 13 пунктов. Сигнал: Пробой нижней границы 0.6445 приведет к дальнейшему нисходящему
Таймфреймы М5 и М15 могут иметь больше ложных точек входа.
Открыть график инструмента в новом окне