

Actual patterns

Patterns are graphical models which are formed in the chart by the price. According to one of the technical analysis postulates, history (price movement) repeats itself. It means that the price movements are often similar in the same situations which makes it possible to predict the further development of the situation with a high probability.
Relevant patterns by InstaTrade is an easy-to-use service which allows you to be aware of latest changes in the market and react to clues from the market in time. In our service you will always find the latest and most relevant patterns on any pair and any timeframe.
Bearish pennant
was formed on 24.03 at 01:00:40 (UTC+0)
signal strength 1 of 5
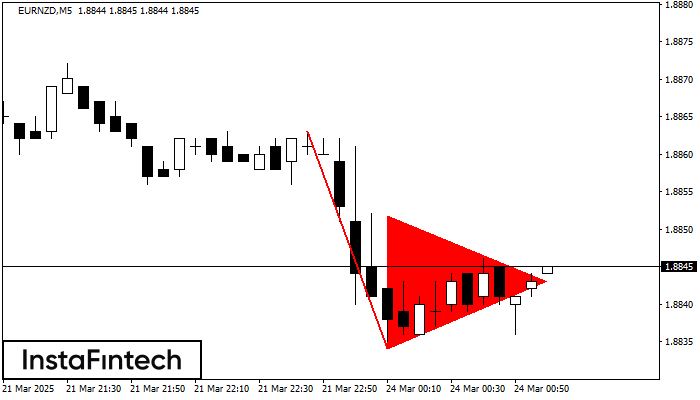
The Bearish pennant pattern has formed on the EURNZD M5 chart. It signals potential continuation of the existing trend. Specifications: the pattern’s bottom has the coordinate of 1.8834; the projection of the flagpole height is equal to 29 pips. In case the price breaks out the pattern’s bottom of 1.8834, the downtrend is expected to continue for further level 1.8819.
The M5 and M15 time frames may have more false entry points.
See Also
- All
- All
- Bearish Rectangle
- Bearish Symmetrical Triangle
- Bearish Symmetrical Triangle
- Bullish Rectangle
- Double Top
- Double Top
- Triple Bottom
- Triple Bottom
- Triple Top
- Triple Top
- All
- All
- Buy
- Sale
- All
- 1
- 2
- 3
- 4
- 5
Doble Techo
was formed on 30.04 at 23:00:21 (UTC+0)
signal strength 5 of 5

En el gráfico de NZDCAD D1 el patrón de reversión Doble Techo ha sido formado. Características: límite superior 0.8316; límite inferior 0.7826; el ancho del patrón 490 puntos. La señal
Open chart in a new window
Triple Piso
was formed on 30.04 at 22:40:20 (UTC+0)
signal strength 1 of 5
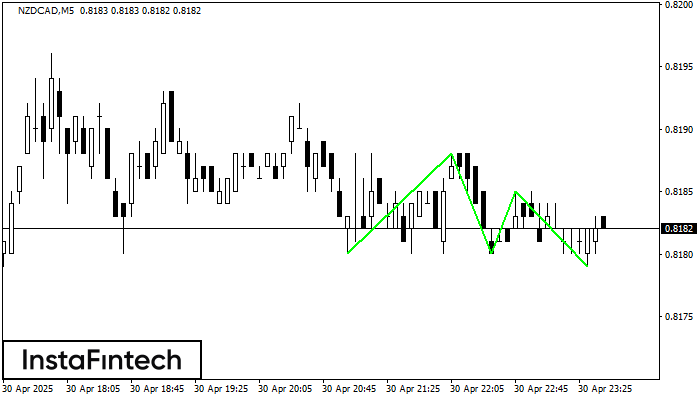
El patrón Triple Piso ha sido formado en NZDCAD M5. Este tiene las siguientes características: nivel de resistencia 0.8188/0.8185; nivel de soporte 0.8180/0.8179; el ancho es 8 puntos. En caso
Los marcos de tiempo M5 y M15 pueden tener más puntos de entrada falsos.
Open chart in a new window
Triángulo Simétrico Alcista
was formed on 30.04 at 21:56:12 (UTC+0)
signal strength 2 of 5

Según el gráfico de M15, el #Bitcoin formó el patrón Triángulo Simétrico Alcista. El límite inferior del patrón toca las coordenadas 92482.78/94081.93 donde el límite superior cruza 95186.64/94081.93
Los marcos de tiempo M5 y M15 pueden tener más puntos de entrada falsos.
Open chart in a new window


