

Padrões atuais

Padrões são modelos gráficos que são formados no gráfico pelo preço. Segundo um dos postulados da análise técnica, a história (movimento de preços) se repete. Isso significa que os movimentos de preços geralmente são semelhantes nas mesmas situações, o que possibilita prever o desenvolvimento futuro da situação com alta probabilidade.
Os padrões relevantes da InstaTrade são um serviço fácil de usar, que permite que você esteja ciente das últimas mudanças no mercado e reaja a indícios do mercado a tempo. Em nosso serviço, você sempre encontrará os padrões mais recentes e relevantes em qualquer par e em qualquer período gráfico.
Double Top
was formed on 28.04 at 09:40:28 (UTC+0)
signal strength 1 of 5
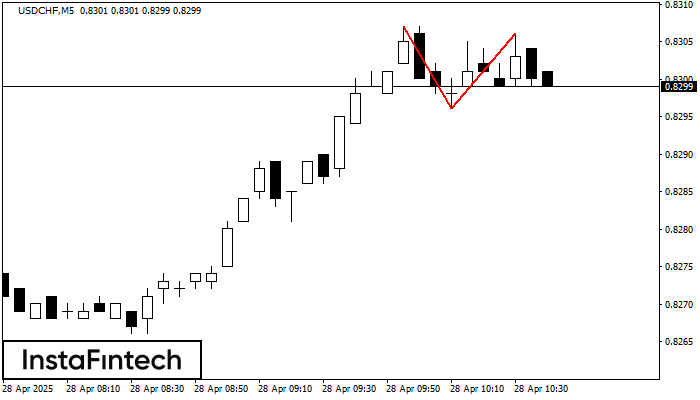
The Double Top reversal pattern has been formed on USDCHF M5. Characteristics: the upper boundary 0.8307; the lower boundary 0.8296; the width of the pattern is 10 points. Sell trades are better to be opened below the lower boundary 0.8296 with a possible movements towards the 0.8281 level.
The M5 and M15 time frames may have more false entry points.
Veja também
- All
- All
- Bearish Rectangle
- Bearish Symmetrical Triangle
- Bearish Symmetrical Triangle
- Bullish Rectangle
- Double Top
- Double Top
- Triple Bottom
- Triple Bottom
- Triple Top
- Triple Top
- All
- All
- Buy
- Sale
- All
- 1
- 2
- 3
- 4
- 5
Bullish pennant
was formed on 08.05 at 16:10:28 (UTC+0)
signal strength 1 of 5
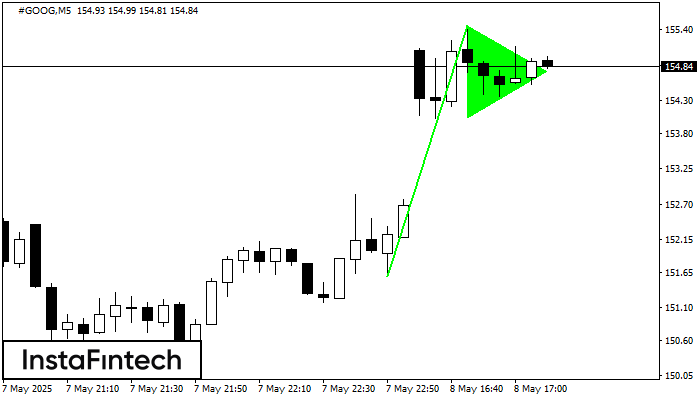
The Bullish pennant graphic pattern has formed on the #GOOG M5 instrument. This pattern type falls under the category of continuation patterns. In this case, if the quote can breaks
The M5 and M15 time frames may have more false entry points.
Open chart in a new window
Double Bottom
was formed on 08.05 at 16:00:26 (UTC+0)
signal strength 4 of 5
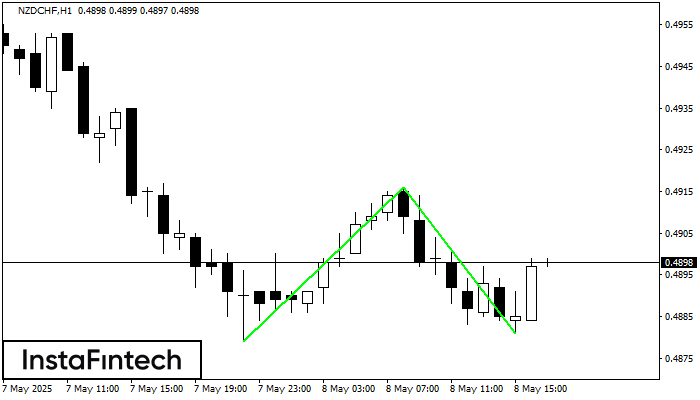
The Double Bottom pattern has been formed on NZDCHF H1. Characteristics: the support level 0.4879; the resistance level 0.4916; the width of the pattern 37 points. If the resistance level
Open chart in a new window
Bullish Symmetrical Triangle
was formed on 08.05 at 15:55:47 (UTC+0)
signal strength 1 of 5
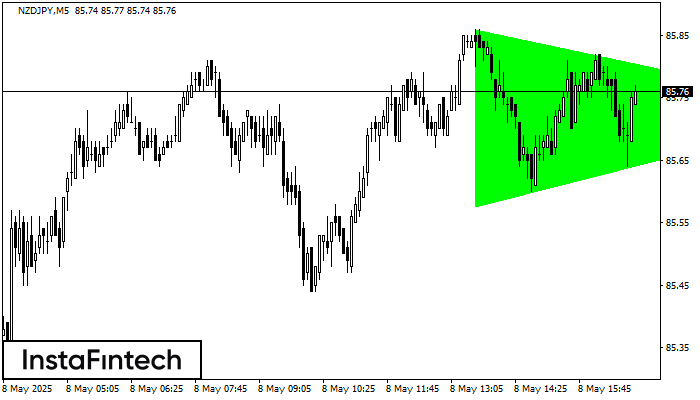
According to the chart of M5, NZDJPY formed the Bullish Symmetrical Triangle pattern. The lower border of the pattern touches the coordinates 85.58/85.73 whereas the upper border goes across 85.86/85.73
The M5 and M15 time frames may have more false entry points.
Open chart in a new window


