

Padrões atuais

Padrões são modelos gráficos que são formados no gráfico pelo preço. Segundo um dos postulados da análise técnica, a história (movimento de preços) se repete. Isso significa que os movimentos de preços geralmente são semelhantes nas mesmas situações, o que possibilita prever o desenvolvimento futuro da situação com alta probabilidade.
Os padrões relevantes da InstaTrade são um serviço fácil de usar, que permite que você esteja ciente das últimas mudanças no mercado e reaja a indícios do mercado a tempo. Em nosso serviço, você sempre encontrará os padrões mais recentes e relevantes em qualquer par e em qualquer período gráfico.
Bullish Rectangle
was formed on 28.04 at 01:22:38 (UTC+0)
signal strength 4 of 5
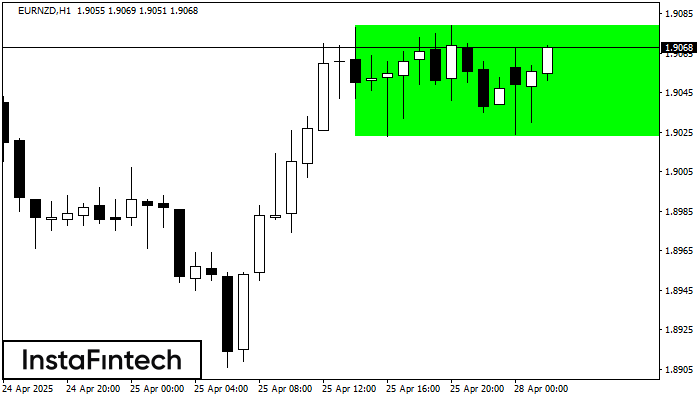
According to the chart of H1, EURNZD formed the Bullish Rectangle which is a pattern of a trend continuation. The pattern is contained within the following borders: the lower border 1.9023 – 1.9023 and upper border 1.9079 – 1.9079. In case the upper border is broken, the instrument is likely to follow the upward trend.
Veja também
- All
- All
- Bearish Rectangle
- Bearish Symmetrical Triangle
- Bearish Symmetrical Triangle
- Bullish Rectangle
- Double Top
- Double Top
- Triple Bottom
- Triple Bottom
- Triple Top
- Triple Top
- All
- All
- Buy
- Sale
- All
- 1
- 2
- 3
- 4
- 5
Retângulo de alta
was formed on 11.05 at 01:12:20 (UTC+0)
signal strength 1 of 5

De acordo com o gráfico de M5, #Bitcoin formou Retângulo de alta. O padrão indica uma continuação da tendência. O limite superior é 103800.29, o limite inferior é 103508.08
Os intervalos M5 e M15 podem ter mais pontos de entrada falsos.
Open chart in a new window
Topo duplo
was formed on 11.05 at 00:45:18 (UTC+0)
signal strength 1 of 5

No gráfico de #Bitcoin M5 o padrão de reversão Topo duplo foi formado. Características: o limite superior 103800.29; o limite inferior 103508.08; a largura do padrão 29221 pontos. O sinal
Os intervalos M5 e M15 podem ter mais pontos de entrada falsos.
Open chart in a new window
Retângulo de alta
was formed on 09.05 at 22:57:29 (UTC+0)
signal strength 1 of 5

De acordo com o gráfico de M5, GBPJPY formou Retângulo de alta. O padrão indica uma continuação da tendência. O limite superior é 193.44, o limite inferior é 193.24
Os intervalos M5 e M15 podem ter mais pontos de entrada falsos.
Open chart in a new window


