

Padrões atuais

Padrões são modelos gráficos que são formados no gráfico pelo preço. Segundo um dos postulados da análise técnica, a história (movimento de preços) se repete. Isso significa que os movimentos de preços geralmente são semelhantes nas mesmas situações, o que possibilita prever o desenvolvimento futuro da situação com alta probabilidade.
Os padrões relevantes da InstaTrade são um serviço fácil de usar, que permite que você esteja ciente das últimas mudanças no mercado e reaja a indícios do mercado a tempo. Em nosso serviço, você sempre encontrará os padrões mais recentes e relevantes em qualquer par e em qualquer período gráfico.
Triple Bottom
was formed on 26.04 at 07:45:27 (UTC+0)
signal strength 2 of 5

The Triple Bottom pattern has formed on the chart of the #Bitcoin M15 trading instrument. The pattern signals a change in the trend from downwards to upwards in the case of breakdown of 95257.28/95153.13.
The M5 and M15 time frames may have more false entry points.
Veja também
- All
- All
- Bearish Rectangle
- Bearish Symmetrical Triangle
- Bearish Symmetrical Triangle
- Bullish Rectangle
- Double Top
- Double Top
- Triple Bottom
- Triple Bottom
- Triple Top
- Triple Top
- All
- All
- Buy
- Sale
- All
- 1
- 2
- 3
- 4
- 5
Triple Bottom
was formed on 06.05 at 03:00:35 (UTC+0)
signal strength 4 of 5

The Triple Bottom pattern has been formed on GBPCHF H1. It has the following characteristics: resistance level 1.0997/1.0988; support level 1.0919/1.0919; the width is 78 points. In the event
Open chart in a new window
Triple Bottom
was formed on 06.05 at 03:00:33 (UTC+0)
signal strength 4 of 5
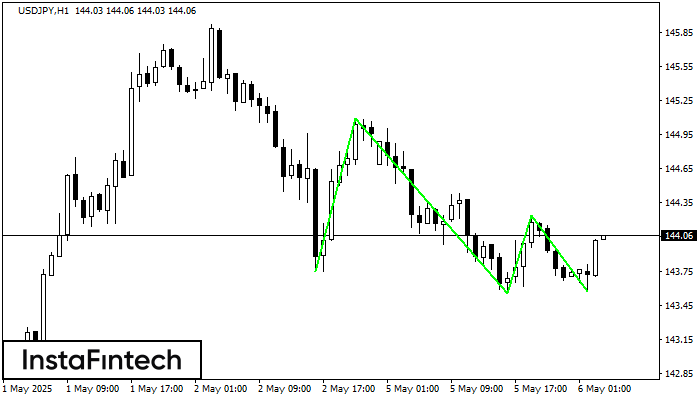
The Triple Bottom pattern has formed on the chart of USDJPY H1. Features of the pattern: The lower line of the pattern has coordinates 145.09 with the upper limit 145.09/144.24
Open chart in a new window
Triple Bottom
was formed on 06.05 at 03:00:33 (UTC+0)
signal strength 4 of 5
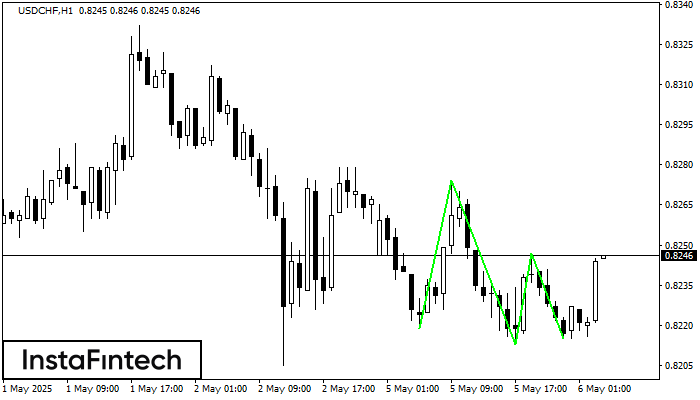
The Triple Bottom pattern has formed on the chart of the USDCHF H1 trading instrument. The pattern signals a change in the trend from downwards to upwards in the case
Open chart in a new window


