

Padrões atuais

Padrões são modelos gráficos que são formados no gráfico pelo preço. Segundo um dos postulados da análise técnica, a história (movimento de preços) se repete. Isso significa que os movimentos de preços geralmente são semelhantes nas mesmas situações, o que possibilita prever o desenvolvimento futuro da situação com alta probabilidade.
Os padrões relevantes da InstaTrade são um serviço fácil de usar, que permite que você esteja ciente das últimas mudanças no mercado e reaja a indícios do mercado a tempo. Em nosso serviço, você sempre encontrará os padrões mais recentes e relevantes em qualquer par e em qualquer período gráfico.
Triple Bottom
was formed on 25.04 at 12:29:55 (UTC+0)
signal strength 2 of 5

The Triple Bottom pattern has formed on the chart of GOLD M15. Features of the pattern: The lower line of the pattern has coordinates 3314.04 with the upper limit 3314.04/3308.41, the projection of the width is 2739 points. The formation of the Triple Bottom pattern most likely indicates a change in the trend from downward to upward. This means that in the event of a breakdown of the resistance level 3286.65, the price is most likely to continue the upward movement.
The M5 and M15 time frames may have more false entry points.
- All
- All
- Bearish Rectangle
- Bearish Symmetrical Triangle
- Bearish Symmetrical Triangle
- Bullish Rectangle
- Double Top
- Double Top
- Triple Bottom
- Triple Bottom
- Triple Top
- Triple Top
- All
- All
- Buy
- Sale
- All
- 1
- 2
- 3
- 4
- 5
Bandeira de Baixa
was formed on 14.05 at 15:29:48 (UTC+0)
signal strength 1 of 5
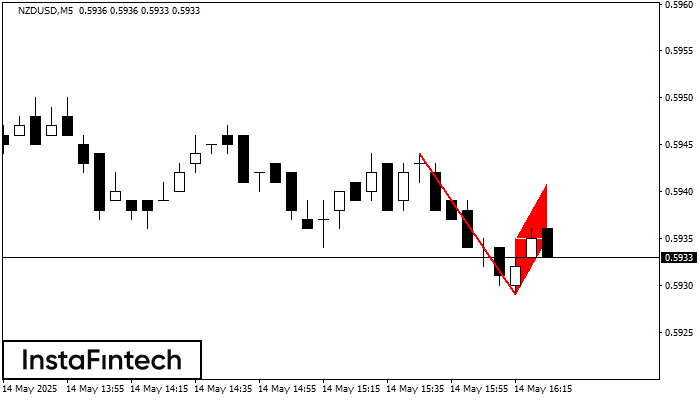
O padrão Bandeira de Baixa foi formado no gráfico NZDUSD M5. Portanto, é provável que a tendência de queda continue a curto prazo. Assim que o preço cair abaixo
Os intervalos M5 e M15 podem ter mais pontos de entrada falsos.
Open chart in a new window
Pennant de baixa
was formed on 14.05 at 15:29:42 (UTC+0)
signal strength 1 of 5
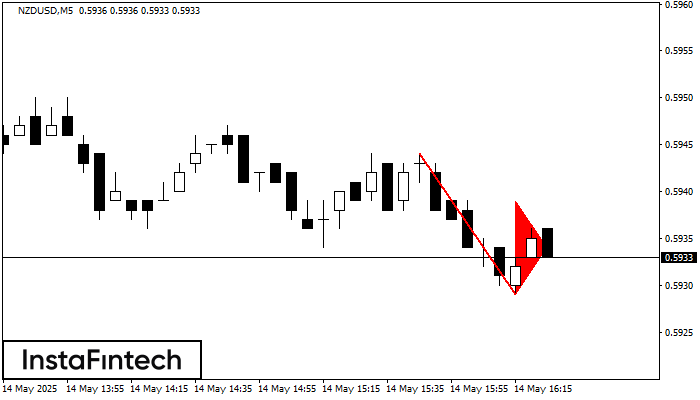
O padrão Pennant de baixa foi formado no gráfico NZDUSD M5. O padrão sinaliza a continuação da tendência de baixa caso o pennant de baixa de 0.5929 for quebrada. Recomendações
Os intervalos M5 e M15 podem ter mais pontos de entrada falsos.
Open chart in a new window
Bandeira de Baixa
was formed on 14.05 at 15:29:34 (UTC+0)
signal strength 1 of 5
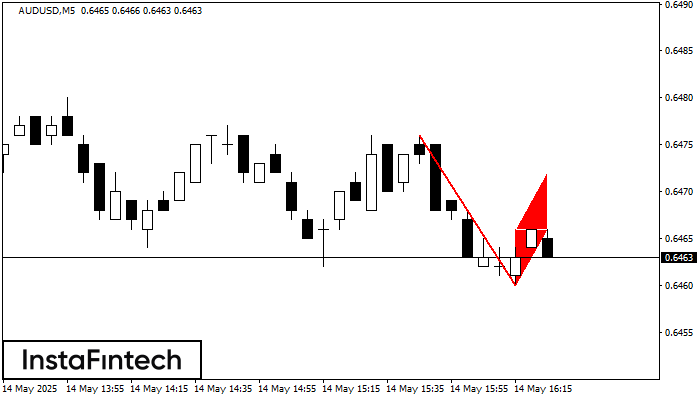
O padrão Bandeira de Baixa foi formado no gráfico AUDUSD M5, o que sinaliza que a tendência de queda continuará. Se o preço quebrar abaixo do mínimo em 0.6460, então
Os intervalos M5 e M15 podem ter mais pontos de entrada falsos.
Open chart in a new window


