

Padrões atuais

Padrões são modelos gráficos que são formados no gráfico pelo preço. Segundo um dos postulados da análise técnica, a história (movimento de preços) se repete. Isso significa que os movimentos de preços geralmente são semelhantes nas mesmas situações, o que possibilita prever o desenvolvimento futuro da situação com alta probabilidade.
Os padrões relevantes da InstaTrade são um serviço fácil de usar, que permite que você esteja ciente das últimas mudanças no mercado e reaja a indícios do mercado a tempo. Em nosso serviço, você sempre encontrará os padrões mais recentes e relevantes em qualquer par e em qualquer período gráfico.
Triple Bottom
was formed on 25.04 at 11:34:47 (UTC+0)
signal strength 1 of 5
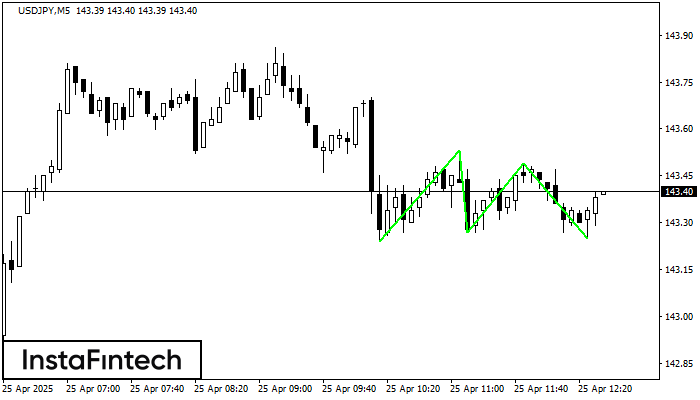
The Triple Bottom pattern has been formed on USDJPY M5. It has the following characteristics: resistance level 143.53/143.49; support level 143.24/143.25; the width is 29 points. In the event of a breakdown of the resistance level of 143.53, the price is likely to continue an upward movement at least to 143.42.
The M5 and M15 time frames may have more false entry points.
- All
- All
- Bearish Rectangle
- Bearish Symmetrical Triangle
- Bearish Symmetrical Triangle
- Bullish Rectangle
- Double Top
- Double Top
- Triple Bottom
- Triple Bottom
- Triple Top
- Triple Top
- All
- All
- Buy
- Sale
- All
- 1
- 2
- 3
- 4
- 5
Double Top
was formed on 13.05 at 17:49:45 (UTC+0)
signal strength 1 of 5
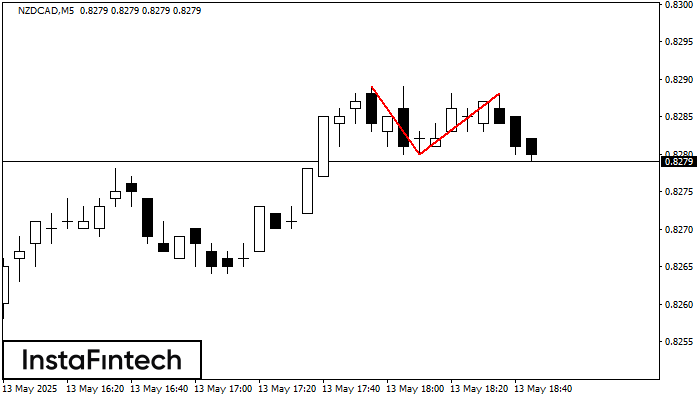
On the chart of NZDCAD M5 the Double Top reversal pattern has been formed. Characteristics: the upper boundary 0.8288; the lower boundary 0.8280; the width of the pattern 8 points
The M5 and M15 time frames may have more false entry points.
Open chart in a new window
Bullish pennant
was formed on 13.05 at 17:45:03 (UTC+0)
signal strength 2 of 5
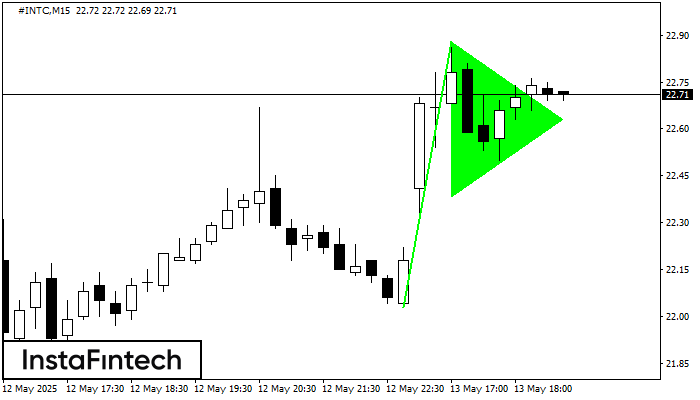
The Bullish pennant signal – Trading instrument #INTC M15, continuation pattern. Forecast: it is possible to set up a buy position above the pattern’s high of 22.88, with the prospect
The M5 and M15 time frames may have more false entry points.
Open chart in a new window
Bullish pennant
was formed on 13.05 at 17:38:08 (UTC+0)
signal strength 3 of 5
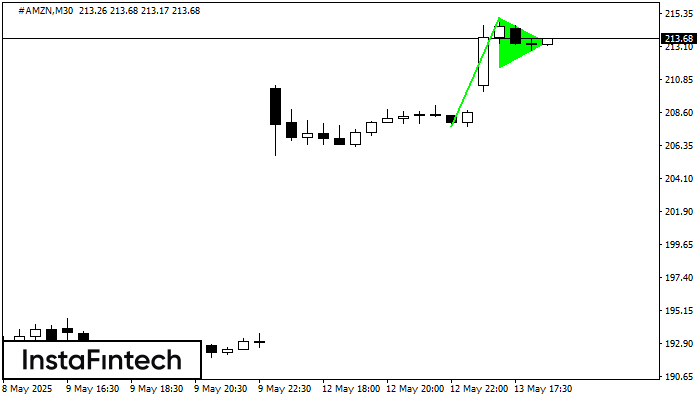
The Bullish pennant signal – Trading instrument #AMZN M30, continuation pattern. Forecast: it is possible to set up a buy position above the pattern’s high of 215.11, with the prospect
Open chart in a new window


