

Padrões atuais

Padrões são modelos gráficos que são formados no gráfico pelo preço. Segundo um dos postulados da análise técnica, a história (movimento de preços) se repete. Isso significa que os movimentos de preços geralmente são semelhantes nas mesmas situações, o que possibilita prever o desenvolvimento futuro da situação com alta probabilidade.
Os padrões relevantes da InstaTrade são um serviço fácil de usar, que permite que você esteja ciente das últimas mudanças no mercado e reaja a indícios do mercado a tempo. Em nosso serviço, você sempre encontrará os padrões mais recentes e relevantes em qualquer par e em qualquer período gráfico.
Inverse Head and Shoulder
was formed on 17.04 at 17:44:51 (UTC+0)
signal strength 1 of 5
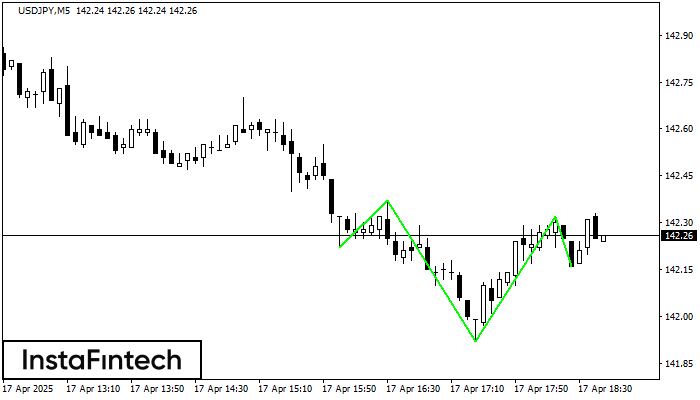
According to the chart of M5, USDJPY produced the pattern termed the Inverse Head and Shoulder. The Head is fixed at 141.92 while the median line of the Neck is set at 142.37/142.32. The formation of the Inverse Head and Shoulder Pattern clearly indicates a reversal of the downward trend. In means that in case the scenario comes true, the price of USDJPY will go towards 142.47.
The M5 and M15 time frames may have more false entry points.
- All
- All
- Bearish Rectangle
- Bearish Symmetrical Triangle
- Bearish Symmetrical Triangle
- Bullish Rectangle
- Double Top
- Double Top
- Triple Bottom
- Triple Bottom
- Triple Top
- Triple Top
- All
- All
- Buy
- Sale
- All
- 1
- 2
- 3
- 4
- 5
Double Top
сформирован 28.05 в 12:45:36 (UTC+0)
сила сигнала 2 из 5
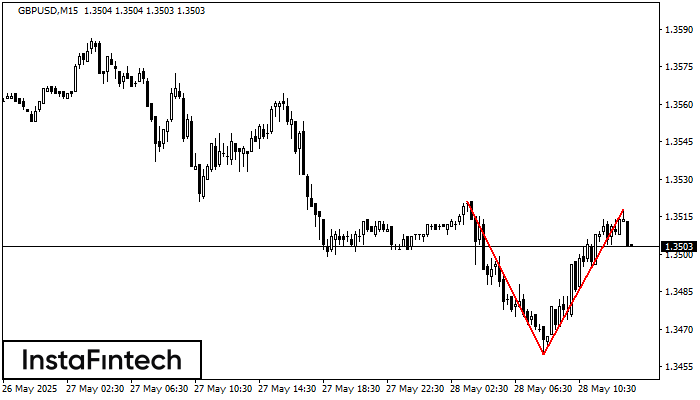
On the chart of GBPUSD M15 the Double Top reversal pattern has been formed. Characteristics: the upper boundary 1.3518; the lower boundary 1.3460; the width of the pattern 58 points
The M5 and M15 time frames may have more false entry points.
Открыть график инструмента в новом окне
Triple Top
сформирован 28.05 в 12:00:34 (UTC+0)
сила сигнала 2 из 5
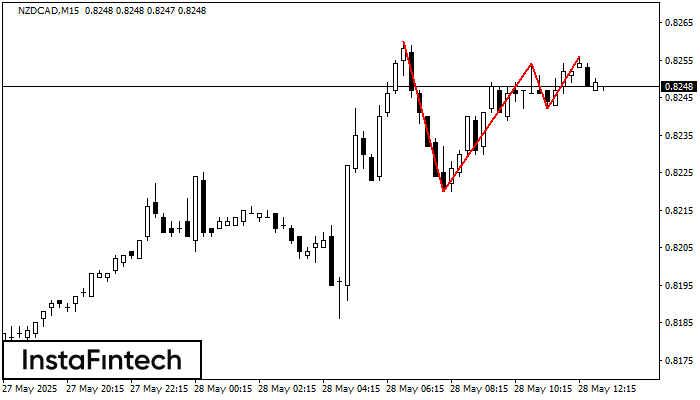
The Triple Top pattern has formed on the chart of the NZDCAD M15 trading instrument. It is a reversal pattern featuring the following characteristics: resistance level 4, support level -22
The M5 and M15 time frames may have more false entry points.
Открыть график инструмента в новом окне
Bullish Rectangle
сформирован 28.05 в 11:56:01 (UTC+0)
сила сигнала 1 из 5
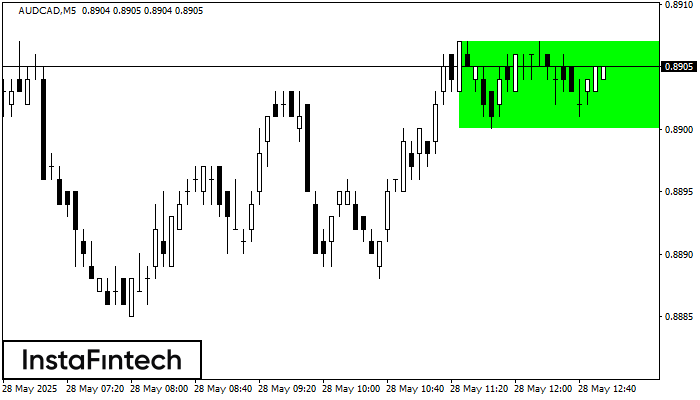
According to the chart of M5, AUDCAD formed the Bullish Rectangle. The pattern indicates a trend continuation. The upper border is 0.8907, the lower border is 0.8900. The signal means
The M5 and M15 time frames may have more false entry points.
Открыть график инструмента в новом окне


