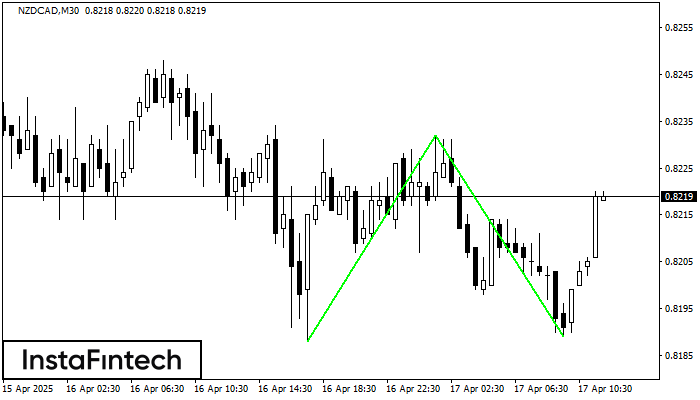
Double Bottom
was formed on 17.04 at 11:00:16 (UTC+0)
signal strength 3 of 5

The Double Bottom pattern has been formed on NZDCAD M30. Characteristics: the support level 0.8188; the resistance level 0.8232; the width of the pattern 44 points. If the resistance level is broken, a change in the trend can be predicted with the first target point lying at the distance of 43 points.
Veja também
- All
- All
- Bearish Rectangle
- Bearish Symmetrical Triangle
- Bearish Symmetrical Triangle
- Bullish Rectangle
- Double Top
- Double Top
- Triple Bottom
- Triple Bottom
- Triple Top
- Triple Top
- All
- All
- Buy
- Sale
- All
- 1
- 2
- 3
- 4
- 5
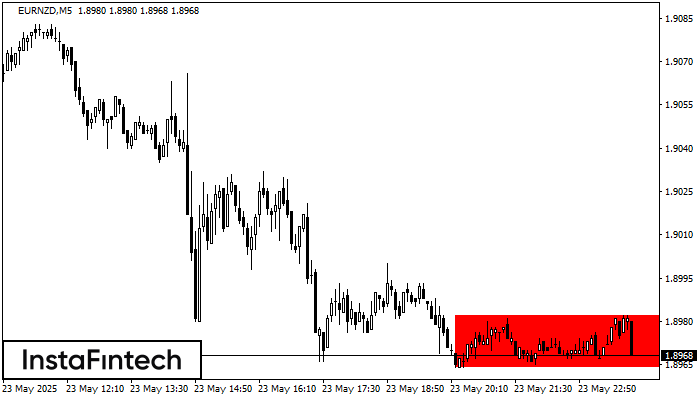
Retângulo de baixa
was formed on 23.05 at 23:00:20 (UTC+0)
signal strength 1 of 5
De acordo com o gráfico de M5, EURNZD formou Retângulo de baixa. O padrão indica uma continuação da tendência. O limite superior é 1.8982, o limite inferior é 1.8964
Os intervalos M5 e M15 podem ter mais pontos de entrada falsos.
Open chart in a new window
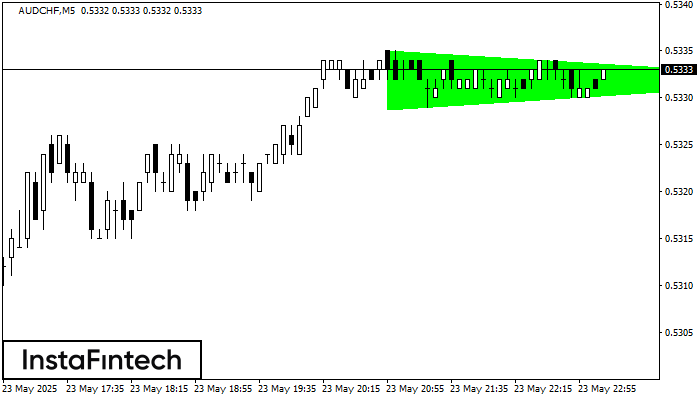
Triângulo Simétrico de Alta
was formed on 23.05 at 22:14:53 (UTC+0)
signal strength 1 of 5
De acordo com o gráfico de M5, AUDCHF formaram o padrão de Triângulo Simétrico de Alta. Descrição: Este é o padrão de uma continuação de tendência. 0.5335 e 0.5329
Os intervalos M5 e M15 podem ter mais pontos de entrada falsos.
Open chart in a new window
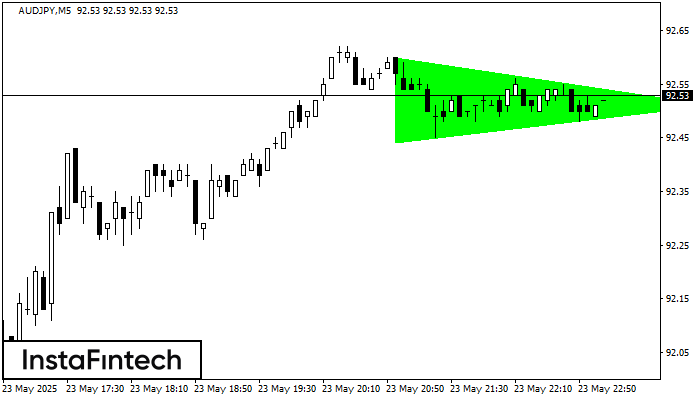
Triângulo Simétrico de Alta
was formed on 23.05 at 22:10:58 (UTC+0)
signal strength 1 of 5
De acordo com o gráfico de M5, AUDJPY formaram o padrão de Triângulo Simétrico de Alta. Descrição: Este é o padrão de uma continuação de tendência. 92.60 e 92.44
Os intervalos M5 e M15 podem ter mais pontos de entrada falsos.
Open chart in a new window


