

Padrões atuais

Padrões são modelos gráficos que são formados no gráfico pelo preço. Segundo um dos postulados da análise técnica, a história (movimento de preços) se repete. Isso significa que os movimentos de preços geralmente são semelhantes nas mesmas situações, o que possibilita prever o desenvolvimento futuro da situação com alta probabilidade.
Os padrões relevantes da InstaTrade são um serviço fácil de usar, que permite que você esteja ciente das últimas mudanças no mercado e reaja a indícios do mercado a tempo. Em nosso serviço, você sempre encontrará os padrões mais recentes e relevantes em qualquer par e em qualquer período gráfico.
Triple Bottom
was formed on 17.04 at 02:00:07 (UTC+0)
signal strength 2 of 5

The Triple Bottom pattern has formed on the chart of the USDJPY M15 trading instrument. The pattern signals a change in the trend from downwards to upwards in the case of breakdown of 142.21/141.96.
The M5 and M15 time frames may have more false entry points.
Veja também
- All
- All
- Bearish Rectangle
- Bearish Symmetrical Triangle
- Bearish Symmetrical Triangle
- Bullish Rectangle
- Double Top
- Double Top
- Triple Bottom
- Triple Bottom
- Triple Top
- Triple Top
- All
- All
- Buy
- Sale
- All
- 1
- 2
- 3
- 4
- 5
Retângulo de alta
was formed on 03.06 at 23:47:07 (UTC+0)
signal strength 1 of 5
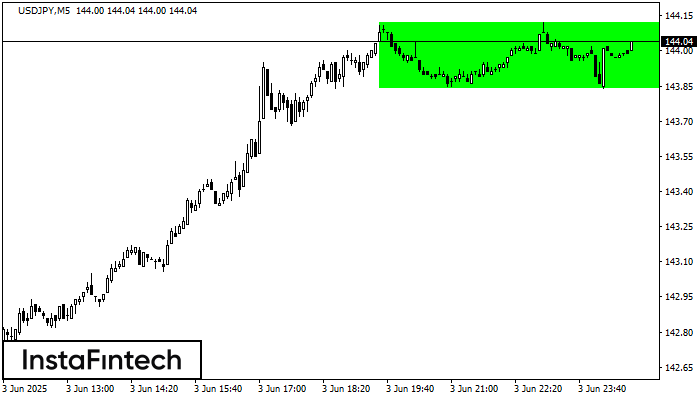
Conforme o gráfico de M5, USDJPY formou o Retângulo de alta. Este tipo de padrão indica uma continuação da tendência. Ele consiste em dois níveis: resistência 144.12 e suporte 143.84
Os intervalos M5 e M15 podem ter mais pontos de entrada falsos.
Open chart in a new window
Retângulo de alta
was formed on 03.06 at 23:46:54 (UTC+0)
signal strength 2 of 5
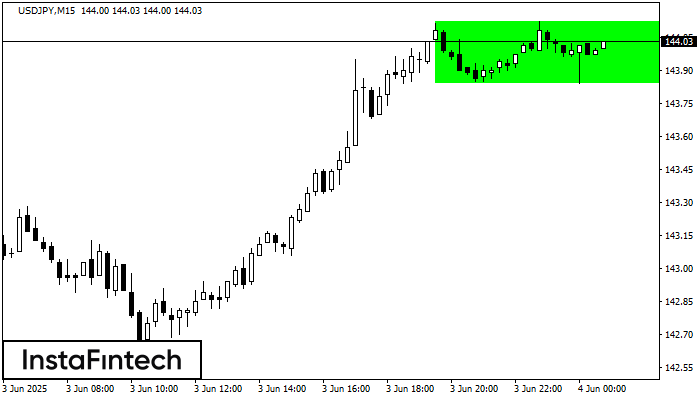
De acordo com o gráfico de M15, USDJPY formou o Retângulo de alta que é um padrão de uma continuação da tendência. O padrão está dentro dos seguintes limites
Os intervalos M5 e M15 podem ter mais pontos de entrada falsos.
Open chart in a new window
Topo duplo
was formed on 03.06 at 23:30:37 (UTC+0)
signal strength 3 of 5
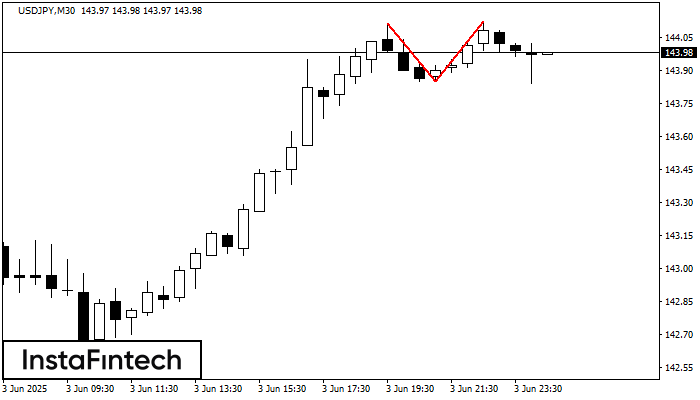
O padrão de reversão Topo duplo foi formado em USDJPY M30. Características: o limite superior 144.11; o limite inferior 143.85; a largura do padrão é de 27 pontos. As operações
Open chart in a new window


