

Padrões atuais

Padrões são modelos gráficos que são formados no gráfico pelo preço. Segundo um dos postulados da análise técnica, a história (movimento de preços) se repete. Isso significa que os movimentos de preços geralmente são semelhantes nas mesmas situações, o que possibilita prever o desenvolvimento futuro da situação com alta probabilidade.
Os padrões relevantes da InstaTrade são um serviço fácil de usar, que permite que você esteja ciente das últimas mudanças no mercado e reaja a indícios do mercado a tempo. Em nosso serviço, você sempre encontrará os padrões mais recentes e relevantes em qualquer par e em qualquer período gráfico.
Bullish Symmetrical Triangle
was formed on 15.04 at 22:01:32 (UTC+0)
signal strength 3 of 5
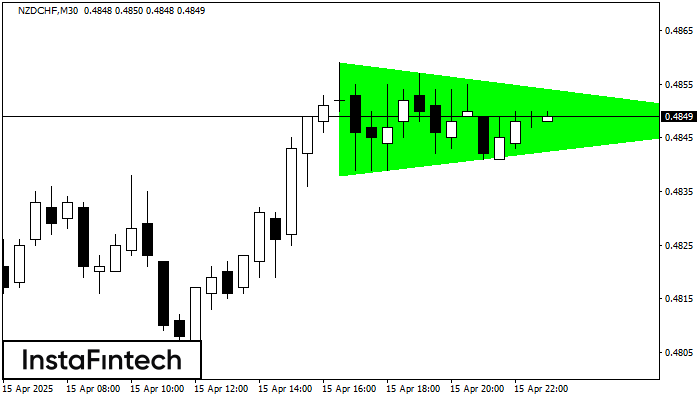
According to the chart of M30, NZDCHF formed the Bullish Symmetrical Triangle pattern. The lower border of the pattern touches the coordinates 0.4838/0.4848 whereas the upper border goes across 0.4859/0.4848. If the Bullish Symmetrical Triangle pattern is in progress, this evidently signals a further upward trend. In other words, in case the scenario comes true, the price of NZDCHF will breach the upper border to head for 0.4878.
Veja também
- All
- All
- Bearish Rectangle
- Bearish Symmetrical Triangle
- Bearish Symmetrical Triangle
- Bullish Rectangle
- Double Top
- Double Top
- Triple Bottom
- Triple Bottom
- Triple Top
- Triple Top
- All
- All
- Buy
- Sale
- All
- 1
- 2
- 3
- 4
- 5
Cabeça & Ombros
was formed on 06.06 at 05:01:27 (UTC+0)
signal strength 4 of 5
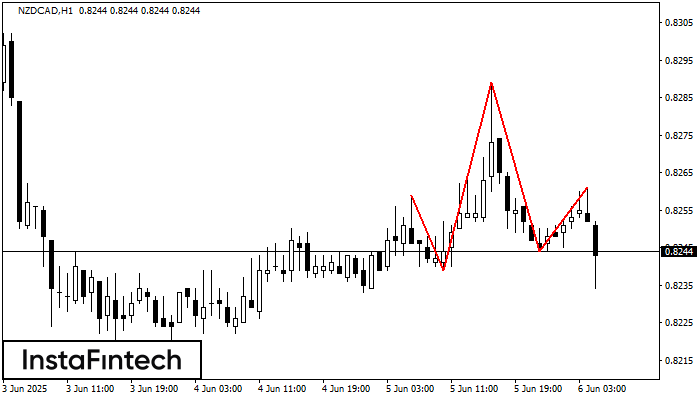
O padrão técnico chamado Cabeça & Ombros apareceu no gráfico de NZDCAD H1. Há razões de peso para sugerir que o preço ultrapassará a Linha do Pescoço 0.8239/0.8244 após
Open chart in a new window
Cabeça & Ombro Invertidos
was formed on 06.06 at 05:00:19 (UTC+0)
signal strength 4 of 5
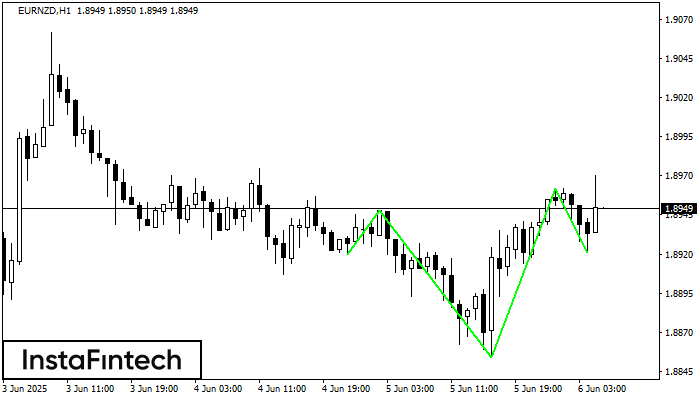
De acordo com H1, EURNZD está moldando o padrão técnico – os Cabeça & Ombro Invertidos. Caso a linha de pescoço 1.8948/1.8962 seja quebrada, o instrumento provavelmente se moverá para
Open chart in a new window
Cabeça & Ombros
was formed on 06.06 at 05:00:14 (UTC+0)
signal strength 4 of 5
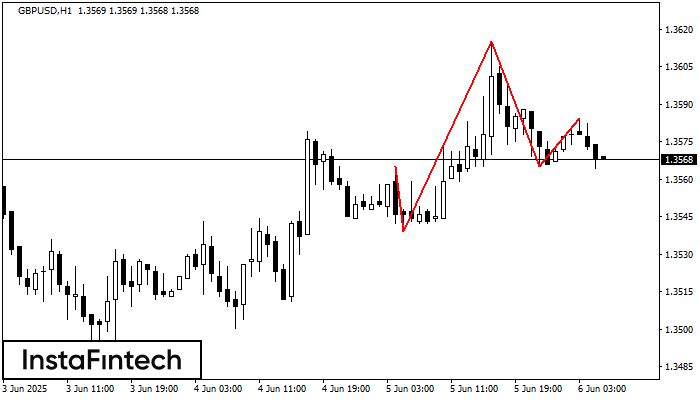
O padrão técnico chamado Cabeça & Ombros apareceu no gráfico de GBPUSD H1. Há razões de peso para sugerir que o preço ultrapassará a Linha do Pescoço 1.3539/1.3565 após
Open chart in a new window


